
Leveraged Russell 2000 ETF Investment Strategy
Maximizing exposure to small-cap growth through triple-leveraged ETFs in the current economic environment
Why Leveraged Russell 2000 ETFs Now?
More investors are turning to leveraged Russell 2000 ETF market to gain amplified exposure to small-cap companies. These investment vehicles provide opportunities to benefit from volatile swings and strong growth potential in the Russell 2000 index.
Historically, small-cap stocks outperform large-caps during economic upturns. With the Federal Reserve's policy shifts and improving economic indicators, leveraged ETFs focused on the Russell 2000 offer potential for substantial returns.
Understanding Leveraged Russell 2000 ETFs
What Are Leveraged Russell 2000 ETFs?
Leveraged ETFs use financial derivatives and borrowing to amplify returns from the Russell 2000 index. These funds typically provide 2x or 3x the daily performance of the underlying index.
Daily Rebalancing
Leverage levels are reset daily to maintain consistent exposure. This requires daily monitoring to ensure leverage stays within target ranges.
Increased Volatility
Leveraged ETFs experience significantly higher price swings compared to traditional ETFs. Daily moves of 5-10% are common during volatile periods.
Amplified Returns
Potential for 3x gains also means 3x losses. These instruments magnify both positive and negative performance of the underlying index.
Key Considerations
- Designed for short-term trading rather than long-term holding
- Compounding effects can create performance drift over extended periods
- Higher expense ratios than traditional ETFs (typically 0.95%-1.25%)
- Requires active monitoring and risk management strategies
Market Environment for 2025
Current economic conditions strongly favor small-cap exposure. The following indicators demonstrate why leveraged Russell 2000 ETFs are positioned for potential growth:
| Economic Indicator | 2024 Status | 2025 Projection | Impact on Small-Caps |
|---|---|---|---|
| GDP Growth | 2.8% | 3.1% | Positive |
| Interest Rates | 5.25% | 4.75% | Very Positive |
| Corporate Earnings | 12% growth | 15% growth | Positive |
| M&A Activity | $2.1T | $2.8T | Very Positive |
| Inflation | 3.4% | 2.5% | Positive |
Additional Resources
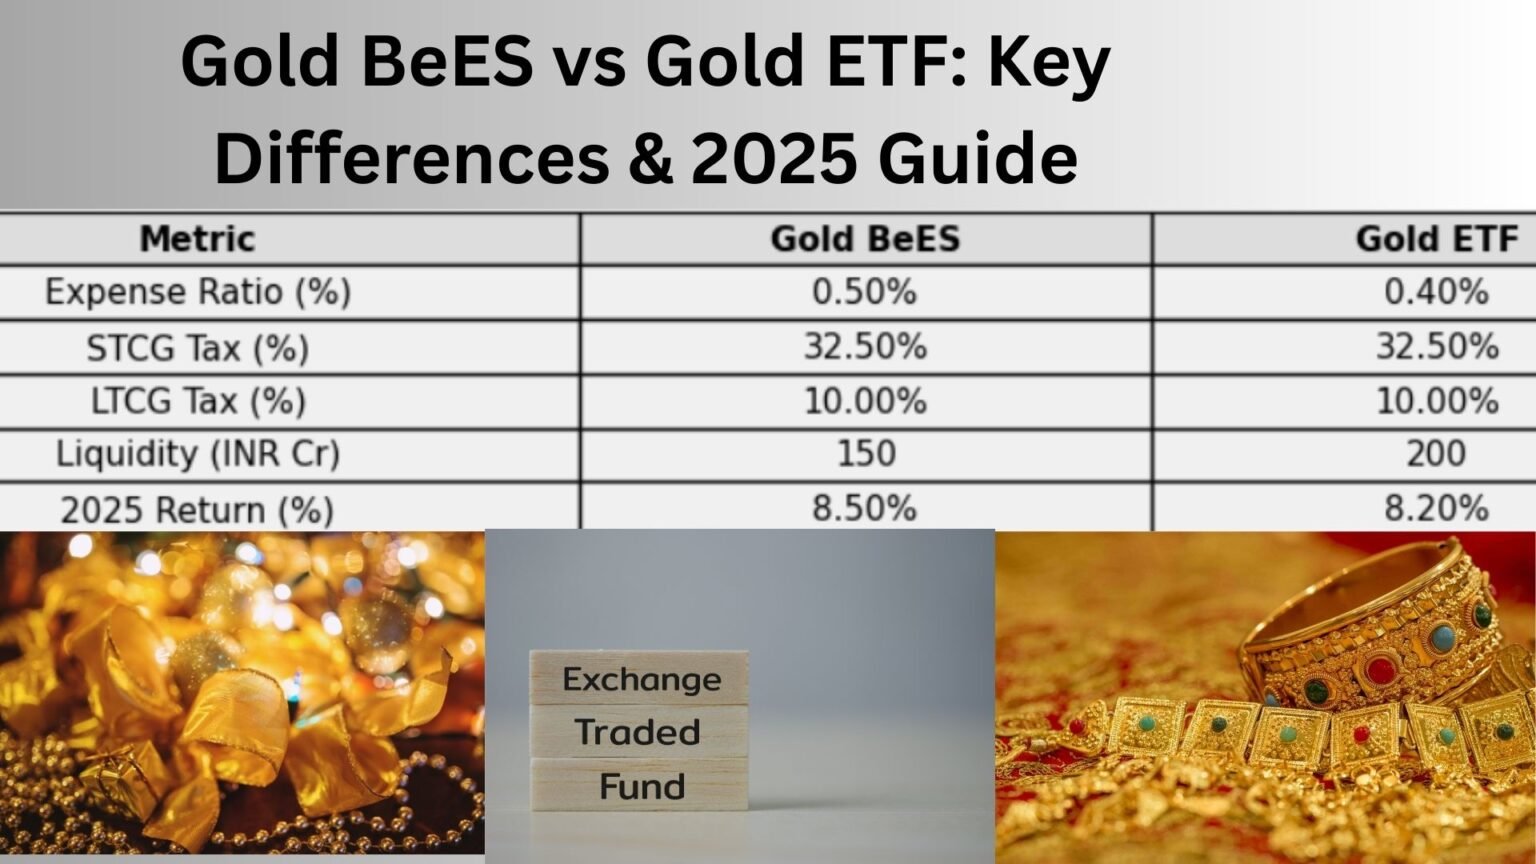
Detailed comparison of gold investment vehicles
Comprehensive overview of ETF structure and mechanics
Detailed information about the small-cap index
Explanation of leverage mechanics and risks
Top 7 Russell 2000 Leveraged & Buffered ETFs
An in-depth look at popular 2x and 3x leveraged and buffered ETFs tracking the Russell 2000 index. This analysis covers their structure, performance, and strategic use cases for different investor profiles.
Quick Navigation: ETF Details | Performance Table | Visualizations | Key Insights
ETF Details
1. ProShares Ultra Russell2000 (UWM)
- Leverage: 2x Long
- Expense Ratio: 0.95%
- AUM: $309.9 M
- 1-Yr Return (NAV): -19.0% (as of 1/31/22)
- Avg. Volume: ~2.1 million shares/day
Why UWM? Best for day or overnight trading due to high liquidity and close tracking of double the index's daily moves. It suits traders with a strong, short-term directional view.
2. Direxion Daily Small Cap Bull 3x (TNA)
- Leverage: 3x Long
- Expense Ratio: 1.03%
- AUM: $1.85 B
- 1-Yr Return: -27.8%
- Avg. Volume: ~8.5 million shares/day
Why TNA? Ideal for momentum trading with its massive liquidity. Traders must be aware of volatility decay in sideways markets.
Also Read: BITO ETF Dividend 2025
3. ProShares UltraPro Russell2000 (URTY)
- Leverage: 3x Long
- Expense Ratio: 0.95%
- AUM: $309.3 M
- 1-Yr Return (NAV): -23.9%
- 30-Day Price Range: ~42%
Why URTY? A strong pick for those wanting to hold a position longer than a day. It offers a robust options market for hedging strategies.
4. Direxion Daily Small Cap Bear 3x (TZA)
- Leverage: 3x Short (Inverse)
- Expense Ratio: 1.07%
- AUM: $323.6 M
- 1-Yr Return: -38.1% (as of 3/31/21)
Use Case: Designed for short-term trades to profit from or hedge against declines in the small-cap market. High volatility makes it suitable for intraday positions.
5. ProShares UltraShort Russell 2000 (RWM)
- Leverage: 2x Short (Inverse)
- Expense Ratio: 0.95%
- AUM: $249.5 M
- 1-Yr Return: -18.8%
Why RWM? A less aggressive inverse ETF than TZA. Its smoother movements make it more manageable for hedging small-cap risk over several days or weeks.
6. Innovator Russell 2000 Power Buffer (KOCT)
- Leverage: 1x Buffered
- Expense Ratio: 0.79%
- AUM: $102.2 M
- 1-Yr Return: +5.46%
Why It's Different: Protects against the first 15% of losses while capping potential upside. Ideal for risk-averse investors wanting small-cap exposure with downside protection.
7. SPDR S&P Russell 2000 Leveraged ETN (RUSL)
- Structure: ETN (Exchange-Traded Note)
- Leverage: 2x Long
- Expense Ratio: ~0.45%¹
- AUM: ~$30 M¹
- ¹Note: RUSL has been delisted and is included for historical comparison.
Structure: As an ETN, it was a debt instrument subject to the credit risk of the issuer, unlike an ETF which holds underlying assets.
Also Read: ISPY Dividend Yield & History
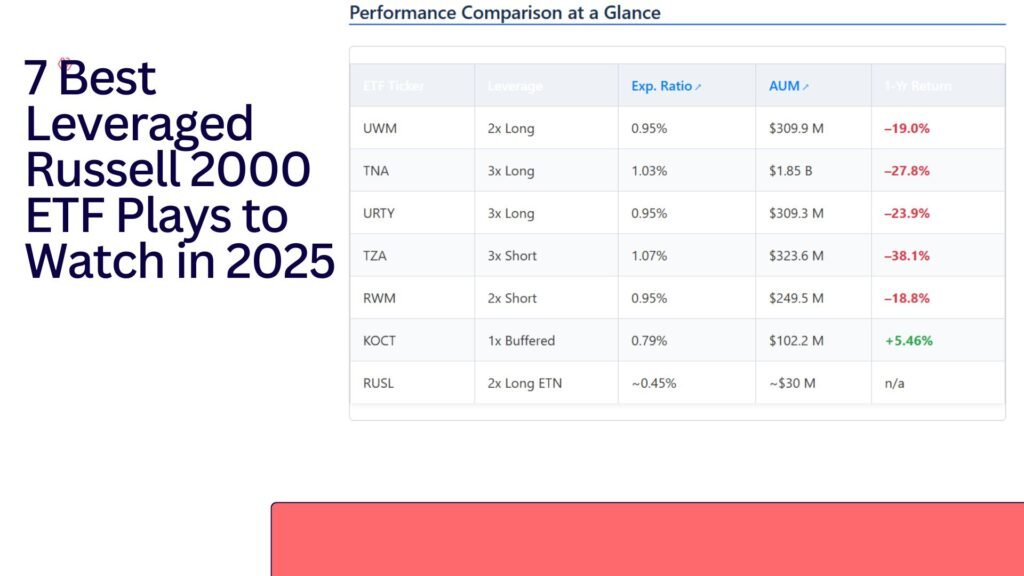
Performance Comparison at a Glance
| ETF Ticker | Leverage | Exp. Ratio | AUM | 1-Yr Return |
|---|---|---|---|---|
| UWM | 2x Long | 0.95% | $309.9 M | –19.0% |
| TNA | 3x Long | 1.03% | $1.85 B | –27.8% |
| URTY | 3x Long | 0.95% | $309.3 M | –23.9% |
| TZA | 3x Short | 1.07% | $323.6 M | –38.1% |
| RWM | 2x Short | 0.95% | $249.5 M | –18.8% |
| KOCT | 1x Buffered | 0.79% | $102.2 M | +5.46% |
| RUSL | 2x Long ETN | ~0.45% | ~$30 M | n/a |
Dynamic Visualizations
1-Year Performance (%)
Assets Under Management (AUM)
Expense Ratio (%)
Key Insights
-
1. KOCT Offers Solid Risk-Adjusted Results
What happened? The buffered ETF, KOCT, was the only fund to deliver a positive return (+5.46%) with a low fee (0.79%). This highlights the value of downside protection in a volatile or bearish market, providing the best "return per fee" score among the group.
-
2. High Leverage Amplified Losses
Who suffered? The 3x leveraged ETFs (TNA, URTY, TZA) saw the most significant drops after fees. High leverage magnifies both gains and losses, and during this period of negative returns, the decay and downside pressure severely impacted performance.
-
3. More Money (AUM) Doesn't Guarantee Better Performance
The evidence: TNA, the largest fund by far at $1.85B in AUM, had one of the worst outcomes (–27.8%). In contrast, the smaller KOCT performed best. This proves that AUM is a measure of popularity and liquidity, not a predictor of performance.
-
4. How This Affects Investment Strategy
Bullish View: TNA and URTY are the primary tools. URTY's slightly lower fee and active options market make it attractive.
Hedging Small-Caps: RWM (2x short) offers smoother inverse tracking compared to the more volatile TZA (3x short), making it better for hedges held over several days.
Conservative Approach: KOCT is the clear choice, offering exposure to potential gains while buffering against significant losses.
Straightforward Ideas for Next Steps
-
Hybrid Allocation
Consider anchoring a portfolio with the stability of KOCT for core small-cap exposure, while using a smaller portion of capital for more active, short-term trades with an ETF like URTY or TNA.
-
Always Be Careful with Expenses
In sideways or negative markets, lower fees become critical. The small fee advantage of a fund like KOCT (0.79%) can make a meaningful difference to your net returns over time.
-
Risk-Adjusted Alerts
When using highly leveraged products like URTY or TNA, set strict risk management rules. For example, establish a condition to sell if the fund's value drops by a predefined percentage (e.g., -25%) to protect capital from rapid decay.


Pingback: MAXI ETF Dividend Yield & History (2025 Updated)