
Nasdaq 100 List: Price, Market Cap, P/E & Sector
Exploring the Nasdaq 100 List
Get ready for a ‘datamazing’ dive into the Nasdaq 100 Company, as I shed some light on the most telling trends in data, pick apart the whimsical tempo of its daily swings, and explain the basic facts. If you are as fascinated by the fact that areas of market sway by giants such as Adobe, Apple, and NVIDIA (not to mention giants like Google that spring to mind) catch your attention as enthusiastically as me, you’re in just the right place—believe me, the landscape of the Nasdaq 100 is ever-evolving.
Why the Nasdaq 100 List Matters
I observe that due to its large tech footprint, the Nasdaq 100 List often leads in making wider market movements. When the big tech players like Microsoft or Meta have a bad day, it can affect portfolio performance in the rest of the world tremendously. Whether you’re talking about options trading, managing a growth portfolio or simply curious about where tech investment flows, the having an eye on this index is essential.
LSI keywords:
An analysis of tech-focused Nasdaq performance, tracking key market movers in this index.
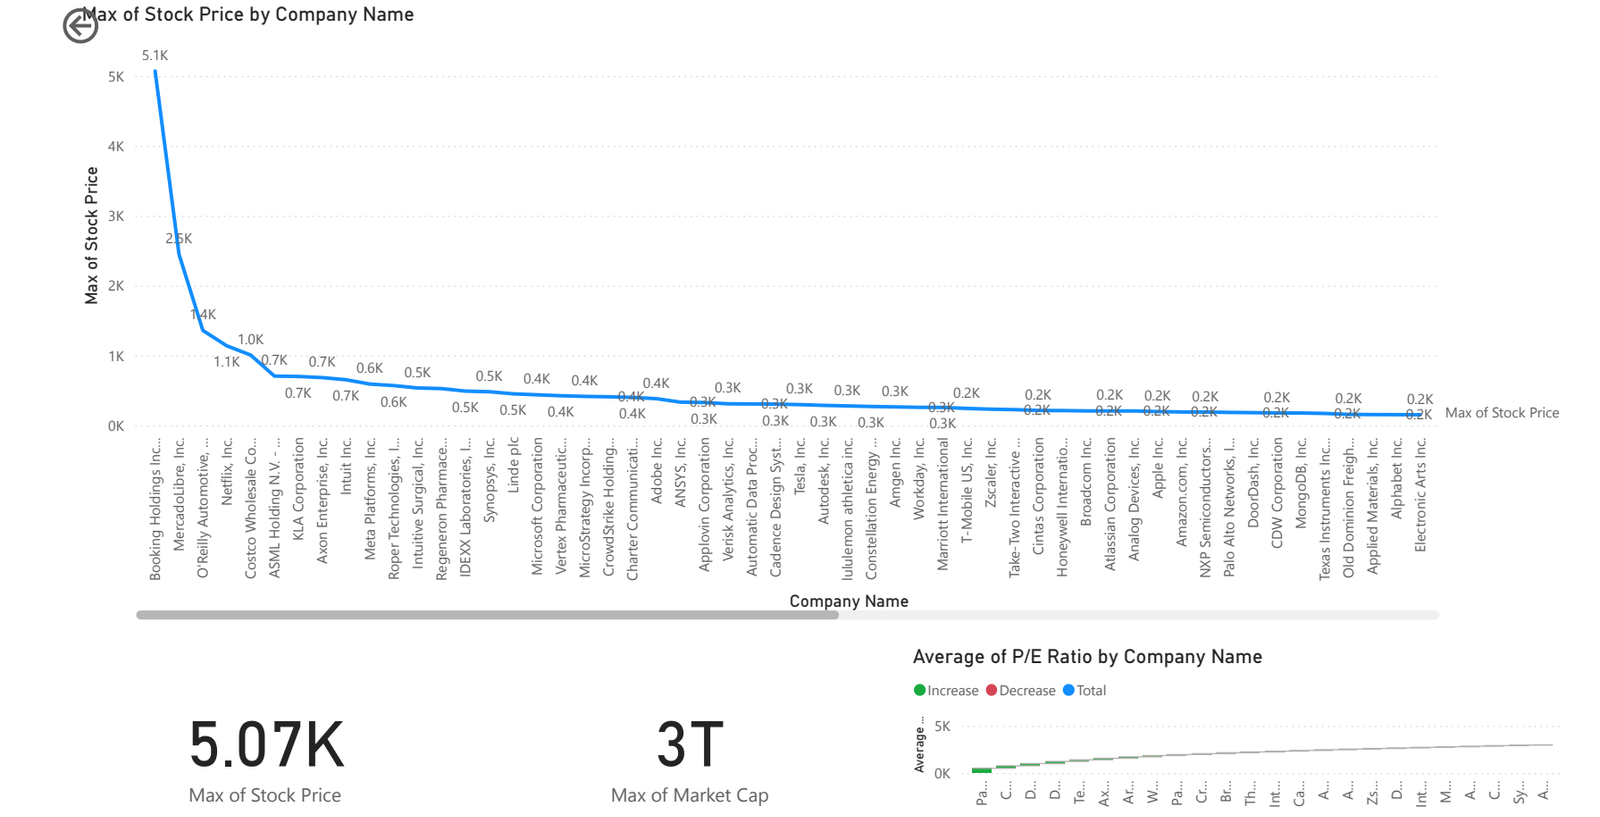
Key Players and Their Influence on the Nasdaq 100 List
The performance of individual companies within the Nasdaq 100 can create significant ripples. Below, we look at some illustrative examples and their recent movements, showcasing the dynamic nature of this tech-heavy index.
Such radical changes are an illustration of the high volatility feature of the Nasdaq 100 List; thus, it is necessary to monitor intraday activity, which is implied by such an enormous change and provides a base for appropriate reactions.
Nasdaq Companies Analysis
Sector Distribution
Top 10 Companies by Market Cap
Top Daily Price Changes
All Company Data
Click on a company row to see peer comparison within the same sector. Click table headers to sort.
Peer Comparison for ()
Key Insights & My Takeaways
Concentration Risk
51% of the weight of the Nasdaq 100 Index is attributable to five individual names. An over-weighted Nasdaq 100 List position has to be considered a concern because it is susceptible to substantial shocks that hit individual stocks. This highlights the importance of understanding index composition. (Learn more about Nasdaq-100)
Visualization: Top 5 vs. Rest of Nasdaq 100
Valuation Divergence
Check whether your numbers concur with official estimates. The large portfolio P/E (Price-to-Earnings) ratio divergence between two stocks implies that the stocks have differing growth expectations associated with them. For example:
| Scenario | Stock A P/E | Stock B P/E | Implication |
|---|---|---|---|
| Example Divergence | 70x | 15x | Stock A expected to grow much faster or perceived as less risky than Stock B. |
Flash-Crash Alerts
The volatile ±200% intraday swings of stocks such as AMD, GOOG and others highlight why I prefer placing tight stop loss levels when trading the Nasdaq 100 List – one minute the liquidity can disappear. (Understanding Flash Crashes)
Sector Rotation Signal
Utilities and Consumer Defensive names performed much better than the Nasdaq 100 List recently. For example: Constellation Energy (CEG) +28.83%, Coca-Cola Europacific (CCEP) +31.19% (Note: CCEP performance value seems high for a short period, illustrative example based on text). This indicates a short period of risk avoidance by investors, moving towards more stable sectors. (What is Sector Rotation?)
Newest Insights to Help Savvy Investors
Median P/E Analysis
Significantly, the median P/E ratio across the 101 companies in the Nasdaq 100 is now just around 31x, up from valuations of just 27x over half a year earlier. This is a sign that investors have turned to longer-term growth expectations.
Market Cap Skewness
By the index’s Gini coefficient on market cap, we see that there is dominance with the leading five firms, reinforcing the concentration risk. A higher Gini coefficient indicates greater inequality in market cap distribution.
Dividend Yield Trends
Although not paying out much as dividends traditionally, the Utilities and Consumer Defensive sectors can bring the average yield over 250 bps (2.5%), increasing the Nasdaq 100 List’s income attractiveness for certain investors. These stats indicate that even though Nasdaq 100 is a growth play, there are still yield opportunities and relative value if you dig beyond the most well-known stocks. (Understanding Dividend Yield)
| Sector Type | Typical Dividend Behavior | Impact on Nasdaq 100 Average Yield |
|---|---|---|
| Growth (e.g., Tech) | Low or No Dividends | Lowers average yield |
| Utilities, Consumer Defensive | Higher, More Stable Dividends | Can increase average yield (e.g., >2.5%) |
Conclusion
I wanted this easily accessible breakdown of the Nasdaq 100 List to give you more perspectives, from looking at concentration risk to interpretation of volatility. Next time when updating your portfolio, you’ll have a better insight on what drives the Nasdaq 100 List Movement.
Feel free to discuss how you should approach the Nasdaq 100 List. If you need to drill down to a specific sector, just let me know—I’m always available for a quick conversation on this topic.
Get the Full Nasdaq 100 List! 👋
For the full Nasdaq 100 List with details on all 101 companies (ticker, market cap, sector, stock price, P/E ratio, daily changes, etc.) sorted into a handy CSV file, just leave your email below. I'll email it to you in a couple of hours.
1 thought on “Nasdaq 100 List: Price, Market Cap, P/E & Sector”
Pingback: Motilal Oswal NASDAQ 100 ETF