
Overview
Company Overview: Cyient DLM Ltd
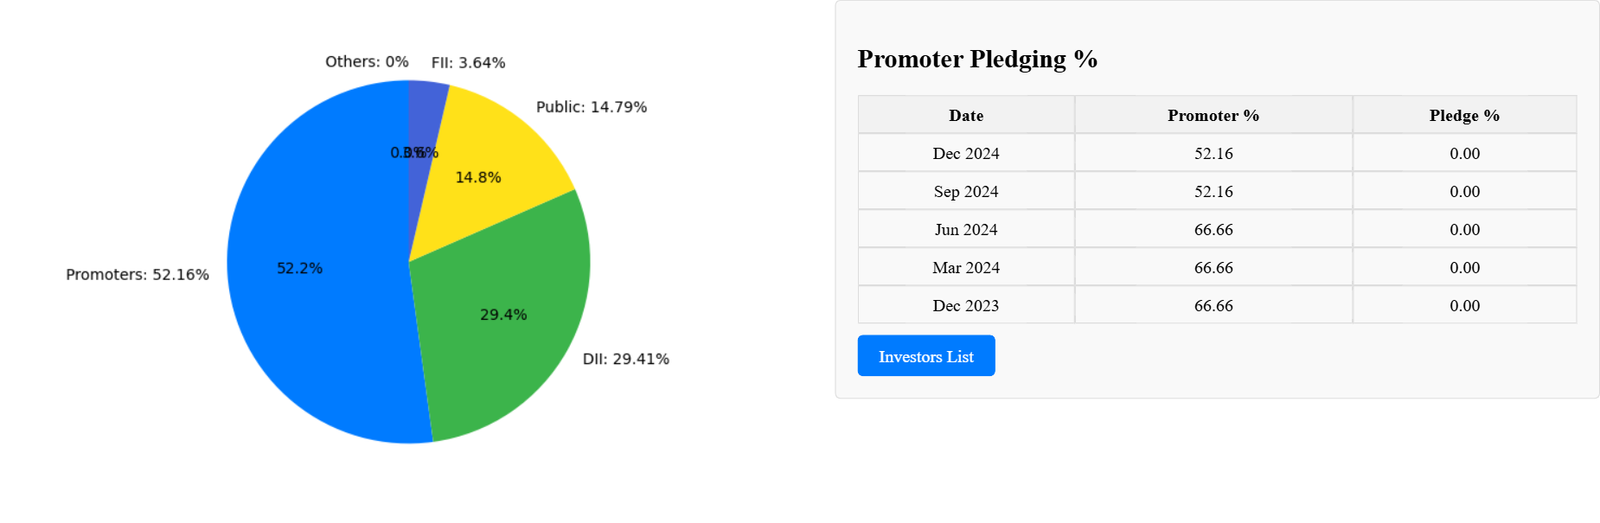
Shareholding Pattern Pie Chart
Key Financial Metrics:
- Market Cap: ₹3,951 Crores
- P/E Ratio: 61.2
- ROE: 11.1%
- Dividend Yield: 0.00%
- 52-Week Range: ₹497 – ₹884
The financial metrics confirm Cyient DLM as a promising growth investment yet its high Price-Earnings ratio suggests market value may be too high.
Recent Price Movements
The stock reached ₹498 during trading on January 24th of 2025 for Cyient DLM. Over the past six months, the stock has experienced significant volatility:
- 6-Month Performance: -21.5%
- 1-Year Performance: -23.9%
- Recent Low: ₹497 (new 52-week low)
Despite a 38.4% YoY increase in revenue in the latest quarter, net profit dropped by 40.8%, raising concerns about operational efficiency and rising expenses.
Volume and Liquidity
During the observed period the stock market has consistently traded about 345,000 shares every day resulting in a delivery percentage of 36.08%. Current data shows market participants show average interest in this stock.
Financials
Technical Analysis: Support and Resistance Levels
The Cyient DLM share price sends essential short-term signals which become clear by examining it from a technical angle.
Moving Averages:
- 50-Day SMA: ₹642.88
- 200-Day SMA: ₹692.35
The current trading position of this share exists at a substantially lower level than its two moving averages suggesting bearish market activity.
Key Levels:
Resistance: ₹525 and ₹550
Support: ₹495 and ₹475
Indicators:
- RSI (Relative Strength Index): The stock stands at a point where possible reversal seems likely due to oversold conditions.
- MACD (Moving Average Convergence Divergence): Downward momentum trends are indicated by the bearish crossover signal.
Candlestick Patterns
Recent candlestick pattern development shows an ascending triangle formation that generally maintains the bears’ control. Such pattern becomes untenable when the stock price crosses ₹525.
Fundamental Analysis: Growth Potential
Revenue and Profitability
During the Q3 FY2025 period Cyient DLM generated ₹444.24 Crores in revenue while showing a 14.07% rise when compared to the previous quarter. However, profit margins remain under pressure:
- Net Profit Margin: 2.47% (down from 3.97% in the previous quarter)
- Earnings Per Share (EPS): ₹1.96 (quarterly)
Sales have grown by 24% cumulatively throughout the last three years at Cyient DLM but growing risks to profitability need monitoring.
Valuation Metrics
- P/B Ratio: 4.23 (above industry median)
- Debt-to-Equity Ratio: 0.15 (low leverage)
The company demonstrates excellent long-term potential through its healthy operations and conservative financial profile while investors should demonstrate caution regarding the elevated market evaluation.
Market Context and Peer Comparison
Operational demands alongside competitive pressures characterizing the electronics sector necessitate innovation and operational efficiency from Cyient DLM. Here’s how it stacks up against peers:
- Honeywell Automation: P/E of 69.7, ROCE of 19.85%
- Syrma SGS Tech: P/E of 79.08, ROCE of 9.84%
Within its competitive sector Cyient DLM maintains a relatively moderate ROCE value at 14.1% that points to opportunities to optimize capital usage.
Investment Recommendations
Based on the analysis, here are our trading recommendations:
- Short-Term: Investors should maintain their position when the stock price drops beneath ₹495. A potential entry point exists at above ₹525 with an aiming price of ₹550.
- Long-Term: The investment window spans two to three years for shares purchased on price declines under 500 rupees with an initial target of achieving 650 rupees per share.


Pingback: Analyzing Tata Motors: Projected Share Price Target for 2030
Pingback: Comprehensive Flipkart Share Price Analysis & Trends
Pingback: Asian Paints Q3 Results: 23.5% Profit Drop, 6% Revenue Fall - Tech Venture Spot