
Update Date : June 9, 2025
Nifty Smallcap 250 PE Ratio
Market insights for informed investment decisions
Small-Cap Investment Overview
Investing in small-cap stocks offers significant growth potential but comes with higher risk. The Nifty Smallcap 250 PE Ratio is a crucial instrument for assessing market sentiment and small-cap stock valuation.
Investors may benefit from an undervalued market (indicated by a low P/E ratio). However, a high PE ratio, such as the current 33.3, may indicate that small-cap companies are overpriced, potentially due to overconfidence or earnings compression.
Historical PE Ratio Analysis
The Nifty Smallcap 250 PE ratio has fluctuated significantly over time. Below is a comparison of historical ranges:
Detailed Historical Ranges
| Time Period | Low | High | Current Status |
|---|---|---|---|
| 5-Year Range | 16.9 | 130.8 | Moderate |
| 2-Year Range | 20.2 | 35.6 | Near High |
| 1-Year Range | 25.9 | 35.6 | High |
| 6-Month Range | 25.9 | 35.6 | High |
| 3-Month Range | 26.6 | 32.9 | High |
| 1-Month Range | 29.4 | 32.9 | High |
Nifty Smallcap 250 Quality 50
This subset ranks the top 50 companies based on:
Return on Equity (ROE) Leverage Ratio EPS Consistency
As of June 9, 2025, the PE ratio for Quality 50 ranges between 26 and 29, marginally below the broader Smallcap 250 index.
The focus on fundamentally stronger businesses suggests better valuations and potentially lower risk for investors seeking small-cap exposure.
Investment Strategy Insights
When the Smallcap 250 PE ratio is high:
- Consider the Quality 50 subset for better valuations
- Dollar-cost averaging reduces timing risk
- Review earnings growth sustainability
- Diversify with other market caps
In undervalued markets (low PE):
- Increase exposure to high-growth small-caps
- Focus on companies with strong balance sheets
- Monitor for sector opportunities
Additional Resources
Nifty Smallcap 250: An Overview
Market Capitalization Distribution
Index Value & PE Ratio Trend
PE Ratio Comparison
Dividend Yield Comparison
1.02%
Nifty Smallcap 250 Yield
1.45%
Nifty 50 Average Yield
5-Year Growth Trajectory
Key Takeaways
✅ Advantages
Strong 30.3% CAGR
Growth potential
Sector diversification
⚠️ Risks
High PE Ratio
Market volatility
Lower dividend yield
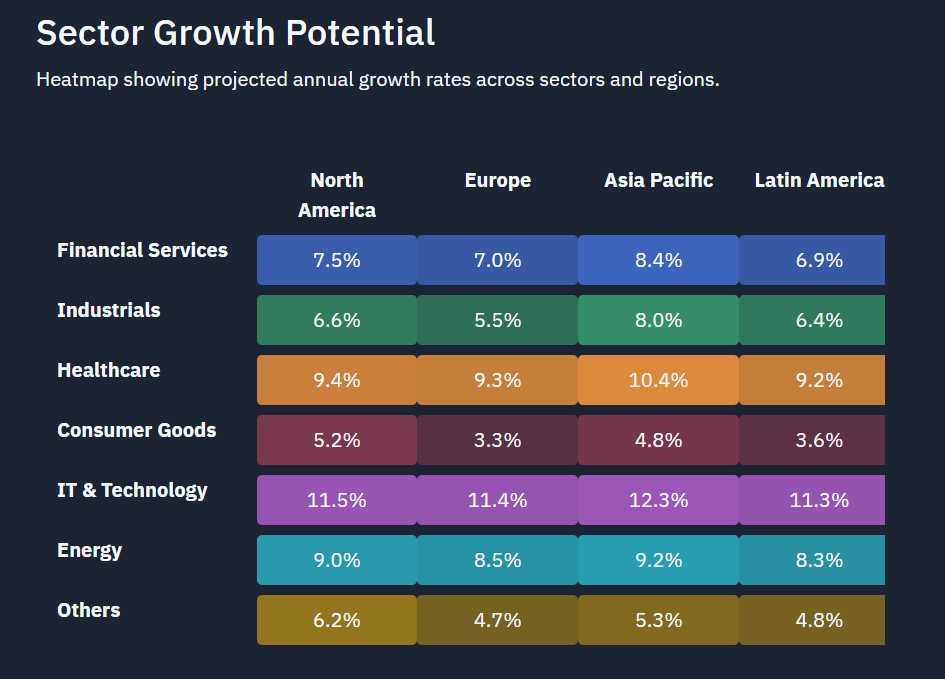
Why Sectoral Diversification Matters
- Risk Mitigation: Diversification prevents a decline in one industry from affecting the overall index performance substantially.
- Exposure to Growth Sectors: IT, Health Care, and Industrials have been good growth directions in the past and can improve index performance.
- Cyclical vs. Defensive Stocks: While Financial Services and Industrials will perform well in booms, Consumer Goods and Healthcare offer protection in slumps.
- Impact of Market Trends: Each industry has its weightage altered depending on trends in the new markets, regulatory shifts, and economic cycles.
Historical Performance of the Index
Investment Growth Analysis
| Period | CAGR (%) | Growth Visualization |
|---|---|---|
| 1 Year | 1.57% | |
| 5 Years | 30.3% | |
| 10 Years | 12.4% | |
| 15 Years | 10.8% |
What Does the Current PE Ratio Suggest?
- High PE (>30): High growth is anticipated by investors, but overvaluation cannot be ruled out.
- Moderate PE (20-30): Steady market with growth prospects of incremental nature.
- Low PE (<20): Potential undervaluation or poor growth prospects.
Expert View: "A high PE ratio doesn't necessarily mean that a stock is overvalued. It shows growth opportunities and investor optimism. Small-cap investors have to balance valuation with future earnings." - Market Analyst
Tech Venture Spot Team
Factors Influencing the PE Ratio
Some of the factors influence the Nifty Smallcap 250 PE Ratio, including:
- Market sentiment: Bullish trends drive PE upwards, and bearish markets lower valuations.
- Economic environment: Small-cap performance is affected by interest rates, inflation, and GDP growth.
- Company fundamentals: Management quality, profit margins, and earnings growth determine individual stock prices.
- Liquidity: Investor attention and trading volume set stock value and prices.
- Geopolitics Risks: Cross-border trade relations, tax policies, and fiscal policies may be responsible for differences in Sectoral PE.
PE Ratio Companion Metrics
Key financial indicators to combine with P/E ratio analysis
Price-to-Book (P/B)
Asset ValuationMeasures market value relative to book value
Debt-to-Equity
Financial HealthShows capital structure balance
| Metric | Significance | Analysis Type |
|---|---|---|
| Return on Equity (ROE) | Profitability relative to shareholder equity | Profitability |
| Earnings Growth | Historical and projected earnings trajectory | Growth Potential |
| Dividend Yield | Income generated from share ownership | Income Quality |
| Operating Margin | Core profitability after variable costs | Efficiency |
Risks and Considerations
- Businesses that belong to the Nifty Smallcap 250 sector demonstrate high price fluctuation.
- Having a low PE ratio does not guarantee a strong stock investment opportunity.
- The market value of small-cap stocks that have low liquidity faces unpredictable price changes due to illiquidity.
- The performance of stocks gets affected by several macroeconomic factors which include interest rates that rise while inflation levels increase together with government-imposed regulations.
- For risk reduction purposes investors should avoid concentrating their investments on a single industry or specific stock.
Conclusion
Programming investors to evaluate small-cap stocks through the valuable measurement tool is the Nifty Smallcap 250 PE Ratio. Market valuation assessments through this indicator help investors detect potential investment prospects. Funding choices should incorporate the PE ratio with other financial indicators when making investment assessments.


Pingback: Sensex PE Ratio Today – Is the Market Overvalued or a Buy?
Pingback: Meta P/E Ratio: Is Now the Best Time to Invest in Meta?
Pingback: Best Low PE Ratio Stocks in India to Buy in 2025