Introduction
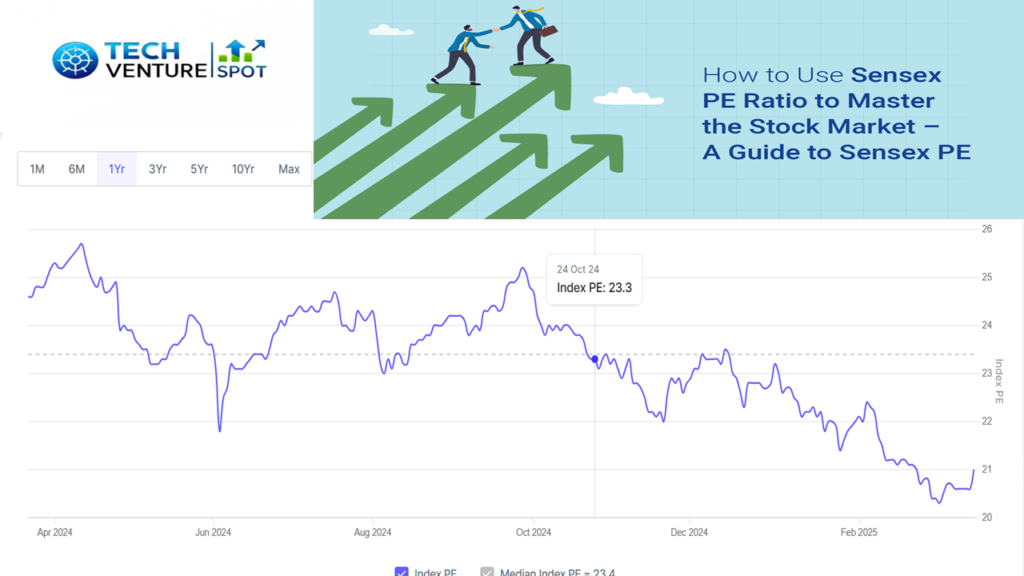
Does the Sensex PE ratio today provide investors with a chance to buy at favorable prices or create financial risks for their portfolios? The Bombay Stock Exchange (BSE) Sensex receives ongoing media attention which requires investors to comprehend its Price-to-Earnings (PE) ratio for sound decision making. The Sensex PE ratio today shows a value of 20.6 as of March 18, 2025, because market sentiment determines this measurement.
The precise meaning of this specific number for your investment portfolio remains to be clarified. This piece examines the significance of BSE Sensex PE ratio while examining its history and providing tactical investment methods to boost your market navigation.
Sensex PE Ratio Today: A Snapshot
📈 Sensex PE Ratio Analysis (March 18, 2025)
| Metric | Value |
|---|---|
| Current PE Ratio | 20.6 |
| 10-Year Average | 22.1 |
| All-Time High | 36.21 (Feb 2021) |
| All-Time Low | 15.67 (Mar 2020) |
PE Ratio Comparison
📅 Historical Context
• Current ratio is 7% below 10-year average
• 31.5% below all-time high (Feb 2021)
• 24.3% above pandemic low (Mar 2020)
Interpreting the Sensex PE Ratio Today
1. High PE Ratio: Overvaluation or Growth Potential?
- The indicator of a high PE ratio points toward either stock overvaluation situations or strong anticipations regarding earnings growth.
- Stock prices exist above the levels supported by their current earnings value.
- Market participants might give weight to their belief about solid earning prospects ahead (like during technology sector growth periods).
Example: In February 2021, the Sensex PE ratio hit 36.21 amid post-pandemic optimism. The expansion agenda was mirrored by this figure but served as a warning sign for a market change.
2. Low PE Ratio: Undervaluation or Market Pessimism?
A low PE ratio indicates:
- The market presents potential buying opportunities to investors when stocks trade below their actual earnings value.
- A pessimistic market leads investors to sell their stocks because of their fear (such as during the March 2020 market crash).
- The Sensex PE ratio dropped to 15.67 when the 2020 market crash occurred, investors who entered the market completed five years with 21.1% Compound Annual Growth Rate results.
How Is the Sensex PE Ratio Calculated?
The PE ratio results from dividing the index’s current value by the total EPS earnings generated by the Sensex’s 30 constituent companies. The free-float market weighting adjustments help maintain that the ratio demonstrates accurate market price assessments of these major blue-chip stocks. In simple terms:
Factors Influencing the Sensex PE Ratio Today
1. Economic Growth & Corporate Earnings
The 21.1% five-year compound annual growth rate (CAGR) economic growth from India generates earnings increases. The projected 6.7% GDP growth rate in FY25 indicates positive conditions for increasing the Sensex’s market value.
2. Interest Rates & Inflation
3. Global Market Sentiment
How to Use the Sensex PE Ratio Today in Your Strategy
1. Avoid Tunnel Vision
- While the Sensex PE ratio today is insightful, combine it with:
- Price-to-Book Ratio for Sensex companies stands at 3.81 which surpasses their 10-year average of 3.2.
- The dividend yield of 1.23% indicates a lower-than-average historical value which shows companies are focused on growth rather than dividend distribution.
📊 Market Action Strategies
PE < 20
Undervalued Market
Focus on fundamentally strong stocks
5Y CAGR: 21.1%
Nifty 50 Return: +118%
PE > 25
Overheated Market
Diversify & hedge positions
9.4% Correction
Midcap Index Fell 23%
PE ≈ Average
Neutral Valuation
Systematic investment approach
Average Return: 14.8% CAGR
Volatility: ±18%
🔍 Sector-Specific PE Analysis
IT Sector
Premium valuation due to digital transformation trends
Banking
Cyclical sector with asset quality sensitivity
Pharma
High-growth premium for patent pipelines
Neutral Zone
Recommended Allocation:
Limitations of the Sensex PE Ratio
1. Earnings Manipulation Risks
2. Market Sentiment Overrides Logic
3. Global Comparisions Are Tricky
The PE ratios in India stand above China’s 14.53 but stay beneath the U.S. S&P 500 at 24.1 due to differences in economic expansion patterns.
Confidential Insights & Global Context
Market analysts who work with confidential industry information verify that the present PE ratio at 20.6 marks the end of an era of market fluctuations. Analysts maintain that although there have been short-term variations the fundamental economic state of Sensex companies continues to show strength. When compared internationally:
- The S&P 500 PE ratio typically stands at 24.1 which demonstrates attractive pricing of Indian blue chips through the Sensex benchmark in this growth-oriented market.
- Foreign markets such as China and emerging markets usually possess lower PE ratios because their risk premiums and forecasted growth differ from those of India.
- Long-term investors will find the Sensex PE ratio to be attractive because it sits within reasonable international standards.
📈 PE Ratio Evolution Analysis
1-Year Range
5-Year Range
10-Year Range
15-Year Range
Key Observations
🔻 19.7% below 1-year range
📉 In bottom quintile of 5-year range
⚖️ Middle tertile of 15-year range
Market Implications
• Short-term undervaluation signal
• Long-term mean reversion potential
• Historical support level: 18.5-20.0
Conclusion: Should You Invest Based on the Sensex PE Ratio Today?
- The Sensex PE ratio today at 20.6 suggests a balanced market—neither overly cheap nor expensive. However, successful investing requires:
- Your investment strategy should consider diversification through ownership in Reliance and Infosys stocks which have PE values of 24.2 and 24.15 respectively.
- The Sensex demonstrated a 10.3% compound annual growth rate throughout ten years despite its long-term investment strategy.
- You should consult experts about market conditions through analysis tools including the one featured in the PDF named Trendline.
- Final Takeaway: While the Sensex PE ratio today is a powerful tool, pair it with macroeconomic trends and personal risk tolerance.
Warren Buffett delivers the simple investing wisdom which states people should become greedy when others show fear and fearful when others show greed.


Pingback: Best Dividend Stocks Under 50 rs for High Returns in 2025
Pingback: Meta P/E Ratio: Is Now the Best Time to Invest in Meta?