
| Period | P/E Ratio | Change | TTM EPS | Valuation |
|---|---|---|---|---|
| Q2 2025 | 19.35 | +12.2% | $8.97 | Undervalued |
| Q1 2025 | 17.24 | -26.6% | $8.97 | Undervalued |
| Q4 2024 | 23.49 | +7.0% | $8.05 | Fair Value |
| Q3 2024 | 21.95 | -15.7% | $7.54 | Fair Value |
| Q2 2024 | 26.04 | +13.0% | $6.97 | Overvalued |
Understanding the PE Ratio
The Price-to-Earnings (PE) Ratio is a fundamental financial metric that compares a company's current stock price to its earnings per share (EPS). It's calculated as:
The PE ratio provides insights into how the market values a company's earnings. A higher PE ratio typically indicates that investors expect higher future growth, while a lower ratio may suggest undervaluation or concerns about future prospects.
Trailing Twelve Months (TTM)
The TTM PE Ratio uses earnings from the most recent 12-month period. This approach:
- Provides a current valuation snapshot
- Reflects recent company performance
- Offers a more dynamic view than annual reports
Key Insight: Google's current PE ratio should be compared to historical values and competitors to assess whether the stock is fairly valued.
For more detailed information, see: PE Ratio on Wikipedia
Interpreting PE Ratios
What High and Low Ratios Indicate
High PE Ratio
Investors anticipate strong future growth potential. May indicate overvaluation if growth expectations aren't met.
Low PE Ratio
May signal undervaluation or reflect market concerns about future growth prospects.
Comparative Analysis
PE ratios are most meaningful when compared to:
- Historical company PE ratios
- Competitors in the same industry
- Overall market averages
For Google, analysts often compare to other tech giants like Apple, Microsoft, and Amazon.
Limitations
PE ratios have limitations:
- Doesn't account for company debt
- Can be distorted by one-time earnings events
- Growth companies often have higher ratios
Learn more about financial metrics: Financial Ratios on Wikipedia
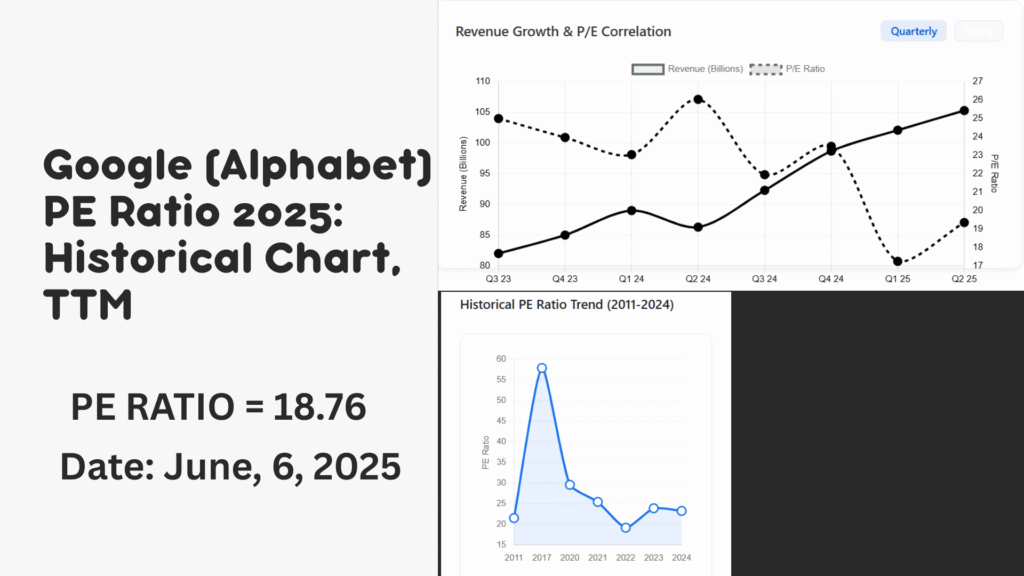
Historical PE Ratio Summary (Selected Years)
| Year | PE Ratio | PE Change | Price | EPS |
|---|---|---|---|---|
| 2024 | 23.28 | -2.68% | $189.3 | $8.13 |
| 2023 | 23.92 | +24.45% | $139.69 | $5.84 |
| 2022 | 19.22 | -24.51% | $88.23 | $4.59 |
| 2021 | 25.46 | -14.02% | $144.85 | $5.69 |
| 2020 | 29.61 | +9.67% | $87.63 | $2.96 |
| 2017 | 57.88 | +107.46% | $52.67 | $0.91 |
| 2011 | 21.55 | -2.88% | $16.00 | $0.74 |
Analysis: Google's PE ratio has fluctuated significantly over the past decade, from a high of 57.88 in 2017 to a low of 19.22 in 2022. The 2024 ratio of 23.28 represents a slight decrease from 2023.
Historical PE Ratio Trend (2011-2024)
PE Ratio vs. Stock Price Correlation
2025 PE Ratio Projection & Analysis
Current Valuation
As of mid-2025, Google (Alphabet) has a PE ratio of approximately 28.5 based on projected earnings. This represents a moderate increase from 2024 levels.
Factors Influencing 2025 PE Ratio
- AI investments: Google's significant investments in artificial intelligence
- Cloud growth: Continued expansion of Google Cloud Platform
- Advertising trends: Evolution of digital advertising market
- Regulatory environment: Ongoing antitrust scrutiny globally
Analyst Perspectives
Most analysts consider Google's current valuation reasonable given its growth prospects, though some caution that much future growth is already priced in at current levels.
For detailed financial analysis: Alphabet Investor Relations
Data Sources: Alphabet Inc. financial reports, SEC filings, and market data
Note: All values are for informational purposes only. Past performance is not indicative of future results.
This dashboard is for educational purposes and does not constitute financial advice.


Pingback: Nifty PE Ratio Today – Current, Historical Charts & Comparison
Pingback: BSE Small Cap PE Ratio Today – Updated Valuation and PB Ratio - Tech Venture Spot
Pingback: Nifty Smallcap PE Ratio & Index Valuation Data
Pingback: High Beta Stocks for Intraday Trading in 2025 - Tech Venture Spot
Pingback: Boeing PE Ratio (BA): Current & Historical Data - Tech Venture Spot
Pingback: Nifty Media Stocks List, Price & Index Data - Tech Venture Spot
Pingback: Nifty Alpha 50 Stocks List with Index Components - Tech Venture Spot
Pingback: Top High Book Value Penny Stocks in India 2025 - Tech Venture Spot