
National Aluminium Co Ltd Price
XNSE: NATIONALUM
₹189.91
▲ +1.35 (+0.72%) today
8 July, 5:19 pm IST · Market Closed
Previous Close
₹188.56
Open
₹188.99
P/E
6.62
Volume
5.59 M
High
₹190.94
52-wk High
₹262.99
Avg Vol
10.05 M
Low
₹188.05
52-wk Low
₹137.75
Mkt Cap
₹346.32 B
Financial Statements
Performance Metrics
Earnings History
Financial Statements
Income Statement (in ₹ Billions)
| Fiscal year ends 31 Mar | 2025 | 2024 | 2023 | 2022 | 2021 | 2020 | 2019 | 2018 |
|---|---|---|---|---|---|---|---|---|
| Revenue | 167.88 | 131.49 | 142.55 | 141.81 | 89.56 | 84.72 | 114.99 | 96.18 |
| Growth YoY | +27.67% | -7.76% | +0.52% | +58.34% | +5.71% | -26.33% | +19.56% | +19.48% |
| Cost of Goods Sold | 51.39 | 72.83 | 89.34 | 62.69 | 44.49 | 49.51 | 55.22 | 49.90 |
| Gross Profit | 116.49 | 58.66 | 53.21 | 79.11 | 45.07 | 35.21 | 59.78 | 46.28 |
| Operating Income | 68.37 | 25.62 | 17.40 | 36.80 | 11.77 | -0.41 | 24.24 | 17.41 |
| Net Profit | 52.68 | 19.88 | 14.35 | 29.51 | 13.00 | 1.36 | 17.34 | 13.42 |
| Diluted EPS | 28.68 | 10.83 | 7.81 | 16.07 | 6.97 | 0.73 | 9.07 | 6.94 |
Balance Sheet (in ₹ Billions)
| Fiscal year ends 31 Mar | 2025 | 2024 | 2023 | 2022 | 2021 | 2020 | 2019 | 2018 |
|---|---|---|---|---|---|---|---|---|
| Current Assets | 91.39 | 61.30 | 52.96 | 64.80 | 43.06 | 45.58 | 56.01 | 55.09 |
| Fixed Assets | 137.43 | 131.05 | 123.30 | 110.07 | 104.03 | 99.90 | 95.47 | 91.03 |
| Current Liabilities | 34.98 | 31.78 | 28.86 | 33.10 | 20.50 | 27.20 | 29.05 | 24.41 |
| Shareholders Equity | 178.05 | 143.88 | 131.26 | 125.52 | 106.79 | 99.87 | 104.85 | 105.04 |
Cash Flow Statement (in ₹ Billions)
| Fiscal year ends 31 Mar | 2025 | 2024 | 2023 | 2022 | 2021 | 2020 | 2019 | 2018 |
|---|---|---|---|---|---|---|---|---|
| Operating Cash Flow | 58.06 | 27.19 | 9.08 | 39.58 | 21.99 | -3.49 | 24.09 | 15.90 |
| Investing Cash Flow | -39.71 | -20.00 | -3.34 | -26.19 | -14.04 | 8.73 | -5.32 | -4.90 |
| Financing Cash Flow | -17.58 | -7.39 | -9.24 | -11.40 | -6.00 | -6.77 | -17.31 | -11.00 |
| Free Cash Flow | 46.05 | 10.63 | -6.26 | 26.75 | 9.80 | -12.06 | 15.32 | 6.30 |
Performance Metrics
Per Share Values (₹)
| Metric | Mar 2025 | 3-Yr Avg | Industry Avg |
|---|---|---|---|
| Revenues | 28.69 | 20.05 | 101.86 |
| Earnings | 11.26 | 3.94 | 6.73 |
| Free Cash Flow | 25.08 | - | 10.53 |
| Dividend | 10.00 | - | 8.49 |
| Book Value | 96.98 | - | 182.60 |
Growth Rates
| Metric | Mar 2025 | 3-Yr Avg | Industry Avg |
|---|---|---|---|
| Revenue YoY | 47.13% | 8.33% | 0.04% |
| EPS YoY | 107.52% | 77.20% | 60.47% |
| FCF YoY | 333.63% | - | -203.02% |
| Dividends YoY | 150.15% | - | 5,534.64% |
| BV YoY | 23.82% | - | 10.04% |
Profitability
| Metric | Mar 2025 | 3-Yr Avg | Industry Avg |
|---|---|---|---|
| Gross Margin | 72.47% | 55.46% | 51.15% |
| Operating Margin | 50.61% | 23.16% | -11.10% |
| Net Margin | 39.24% | 18.14% | 9.71% |
| Return on Equity | 29.27% | - | 0.19% |
Leverage & Liquidity
| Metric | Mar 2025 | 3-Yr Avg | Industry Avg |
|---|---|---|---|
| Debt to EBITDA | 6.60% | - | 729.97% |
| LT Debt to Equity | 1.02% | - | 85.05% |
| Financial Leverage | 1.29x | - | 2.80x |
| Quick Ratio | 2.07x | - | 0.44x |
| Current Ratio | 2.61x | - | 0.70x |
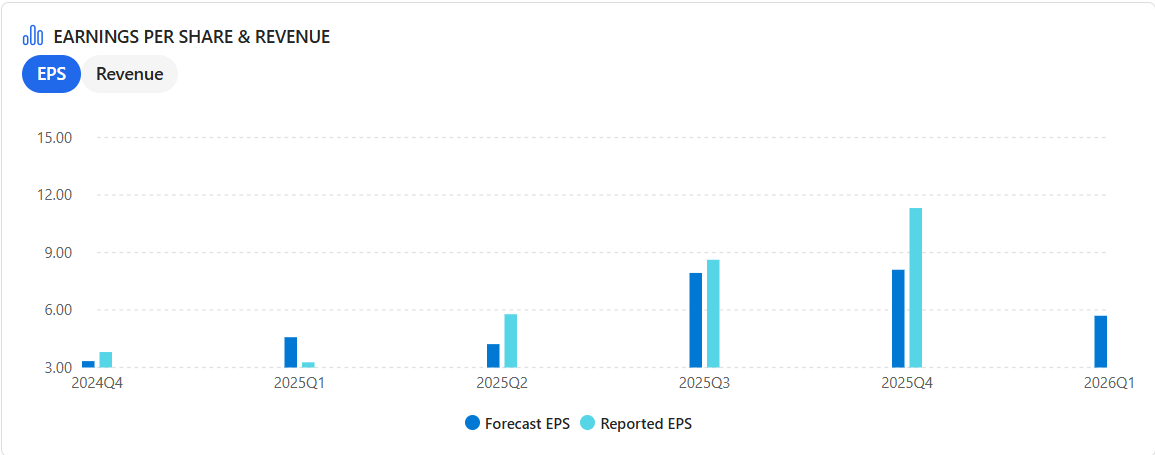
Earnings History
| Report Date | Fiscal Quarter | Forecast/EPS | Last Year's EPS | EPS YoY Change |
|---|---|---|---|---|
| 21 May 2025 | 2025Q4 | 8.10 / 11.32 | 3.81 | ▲ 197.39% (+7.51) |
| 10 Feb 2025 | 2025Q3 | 7.93 / 8.62 | 2.66 | ▲ 224.06% (+5.96) |
| 13 Nov 2024 | 2025Q2 | 4.22 / 5.78 | 1.12 | ▲ 416.07% (+4.66) |
| 12 Aug 2024 | 2025Q1 | 4.58 / 3.27 | 1.90 | ▲ 72.11% (+1.37) |
| 27 May 2024 | 2024Q4 | 3.33 / 3.81 | 2.84 | ▲ 34.03% (+0.97) |
| 13 Feb 2024 | 2024Q3 | 1.27 / 2.66 | 1.49 | ▲ 78.52% (+1.17) |
| 9 Nov 2023 | 2024Q2 | 1.40 / 1.12 | 0.93 | ▲ 20.43% (+0.19) |
| 11 Aug 2023 | 2024Q1 | 2.70 / 1.90 | 3.15 | ▼ -39.68% (-1.25) |


