
Titan Company Limited (TITAN)
Key Factors Affecting Stock
Jewelry Segment Missed Expectations
Titan's jewelry business grew by 18% year-over-year in Q1 FY26, falling short of the 22–23% growth analysts had forecast. This softer-than-expected performance in its core segment has weighed on investor confidence.
Gold Price Volatility
With gold prices jumping around 35% over the past year (and climbing about 15% in the quarter alone), many buyers postponed purchases or opted for lighter, lower-karat pieces—hitting both sales volumes and average transaction sizes.
Rich Valuation Amplifies Reactions
Trading at more than 90 times earnings, Titan is one of the most richly valued consumer stocks. Any sign of earnings pressure tends to trigger sharper sell-offs as investors reassess those premium multiples.
Retail Sentiment Turned Bearish
Recent spikes in negative chatter among retail investors have fueled a downward spiral, with more sellers than buyers pushing the share price lower in thinner trading sessions.
Seasonal Timing Lags Recovery
Strong monsoon forecasts and the fact that major festivals are still months away mean discretionary jewelry purchases typically pick up closer to peak buying seasons—delaying any rebound.
Peer & Market Pressures
Intensifying competition among jewelry chains, combined with broader market volatility and foreign fund outflows, has prompted profit-taking in Tata Group stocks, including Titan.
Financial Performance
Revenue & Profit Growth
Profit Margins
Income Statement (₹ in Billions)
| Financials | 2025 | 2024 | 2023 | 2022 | 2021 |
|---|---|---|---|---|---|
| Revenue | 604.56B | 510.84B | 405.75B | 287.99B | 216.44B |
| Growth YoY | +18.35% | +25.90% | +40.89% | +33.06% | +2.81% |
| Gross Profit | 128.63B | 115.24B | 101.05B | 70.69B | 51.67B |
| Net Profit | 33.37B | 34.96B | 32.50B | 21.73B | 9.73B |
| Diluted EPS | 37.61 | 39.38 | 36.61 | 24.48 | 10.96 |
Balance Sheet (₹ in Billions)
| Balance Sheet | 2025 | 2024 | 2023 | 2022 |
|---|---|---|---|---|
| Current Assets | 344.34B | 256.08B | 224.07B | 174.54B |
| Fixed Assets | 62.13B | 59.42B | 46.16B | 37.40B |
| Current Liabilities | 257.93B | 165.29B | 132.64B | 105.12B |
| Long-Term Debt | 5.95B | 33.02B | 0.00 | 20.00M |
| Shareholders Equity | 116.24B | 93.93B | 118.51B | 93.03B |
Valuation & Profitability
Price to Earnings
Price to Sales
Return on Equity
Net Margin
Leverage & Liquidity
Debt to EBITDA
This high ratio indicates significant debt relative to earnings, which may concern investors during economic downturns.
Long-Term Debt to Equity
Much higher than the sector average of 84.47%, showing a highly leveraged capital structure.
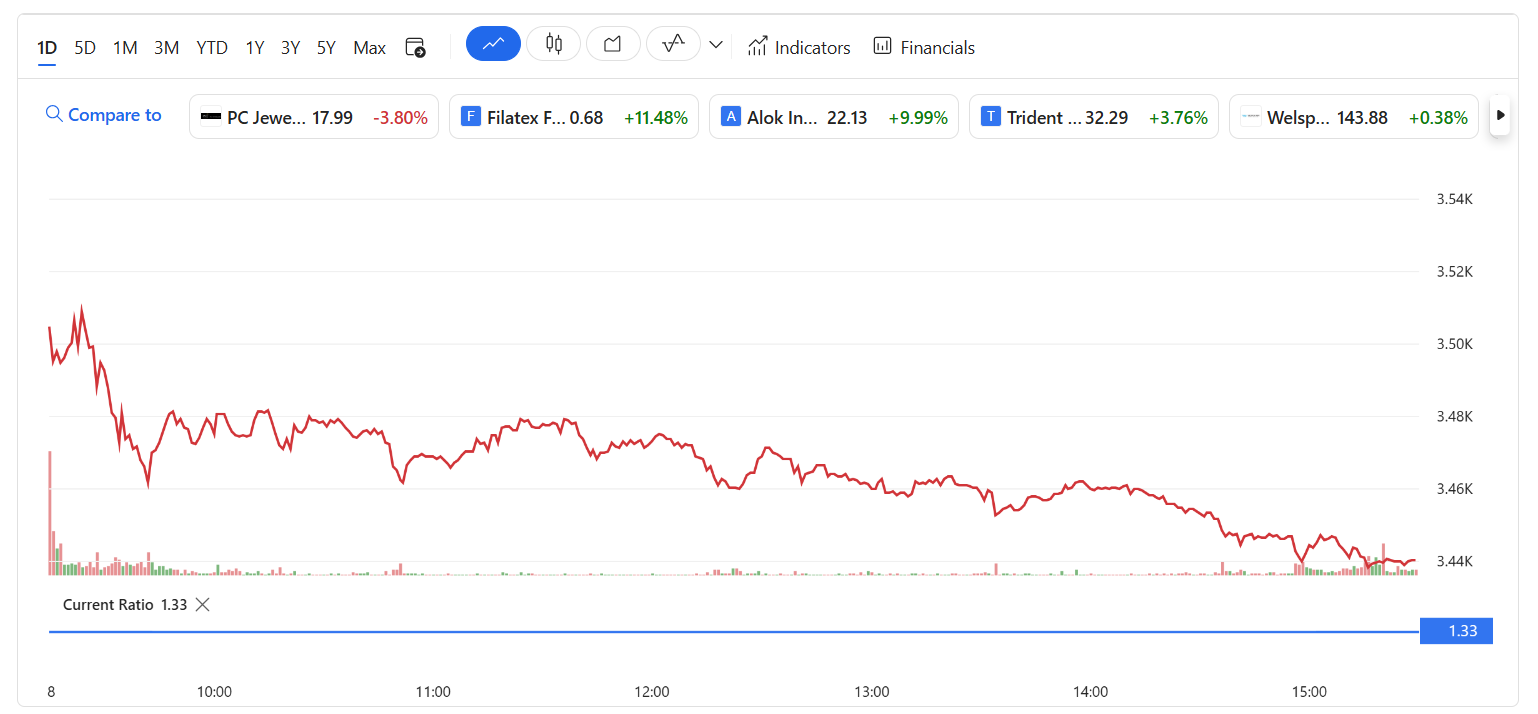
Current Ratio
Indicates sufficient short-term assets to cover liabilities, slightly better than sector average of 1.00x.
Earnings History & Forecast
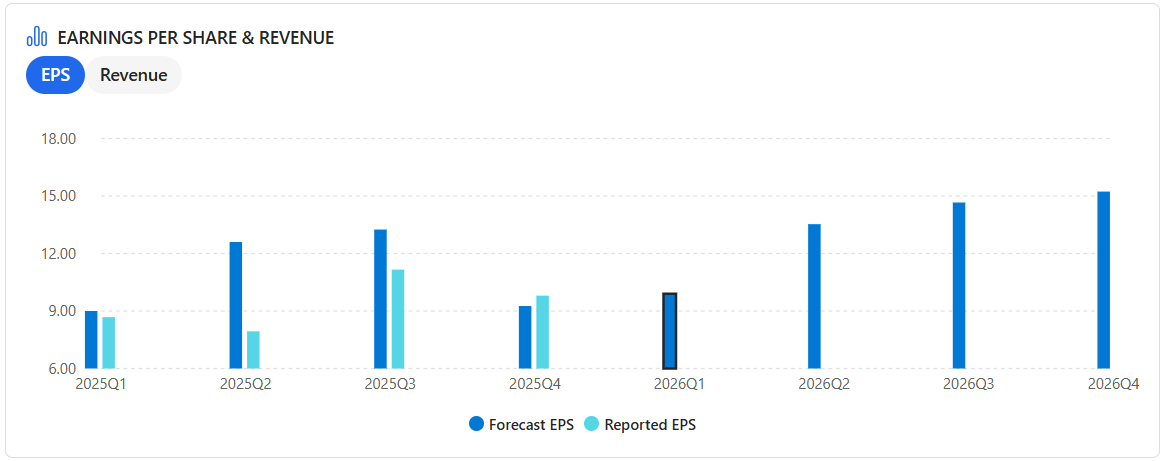
Quarterly EPS Performance
Earnings History (EPS)
| Report Date | Fiscal Quarter | Forecast/EPS | YoY Change |
|---|---|---|---|
| 8 May 2025 | 2025Q4 | 9.26 / 9.80 | +10.73% |
| 4 Feb 2025 | 2025Q3 | 13.25 / 11.16 | -4.78% |
| 5 Nov 2024 | 2025Q2 | 12.60 / 7.94 | -24.95% |
| 2 Aug 2024 | 2025Q1 | 9.00 / 8.68 | -0.91% |
| 3 May 2024 | 2024Q4 | 9.90 / 8.85 | +7.01% |
Next Quarter Forecast
Consensus EPS
Last year's EPS: 8.68
Consensus Revenue
Last year's revenue: 120.53B
Additional Resources
Related Analysis
For more detailed analysis of other stocks, read: Nalco Share Price Today: NSE/BSE Stock Updates & Chart
Financial Concepts Explained
- Earnings Per Share (EPS) - A company's profit divided by its outstanding shares
- Price-to-Earnings Ratio (P/E) - Valuation ratio comparing share price to earnings
- EBITDA - Earnings before interest, taxes, depreciation, and amortization
- Market Capitalization - Total market value of a company's outstanding shares
- Dividend Record Date - Date determining which shareholders receive dividends


