
Introduction
The ITC PE ratio serves as a critical indicator for evaluating the company’s valuation and understanding its growth potential. This article will provide an in-depth analysis of the ITC PE ratio, its historical trends, current performance, and comparisons within the industry. Understanding the PE ratio enables any investor at any experience level to base their financial decisions on sound information.
What is the ITC PE Ratio?
A company’s current stock price to earnings per share (EPS) represents the Price-to-Earnings (PE) ratio measurement. The PE ratio calculation requires this specific mathematical representation.
PE Ratio = Market Price per Share / Earnings per Share (EPS)
Stock values appear to be either overvalued or investors anticipate growth potential when PE ratios climb higher above or undervalued when ratios decrease below base level.
ITC Limited
Valuation
| P/E Ratio | 25.5 |
| Book Value | ₹60.2 |
| ROCE | 37.5% |
| ROE | 28.4% |
Business Segments
| FMCG Others | 23% |
| Hotels | 12% |
| Paperboards | 15% |
| Agri Business | 8% |
Dividend Yield
Stock Performance
| Key Metrics | Value |
|---|---|
| Market Share (Cigarettes) | 80% |
| PBIT Contribution | 78% |
| Volume Growth (Q2 FY25) | 7% YoY |
| Established | 1910 |
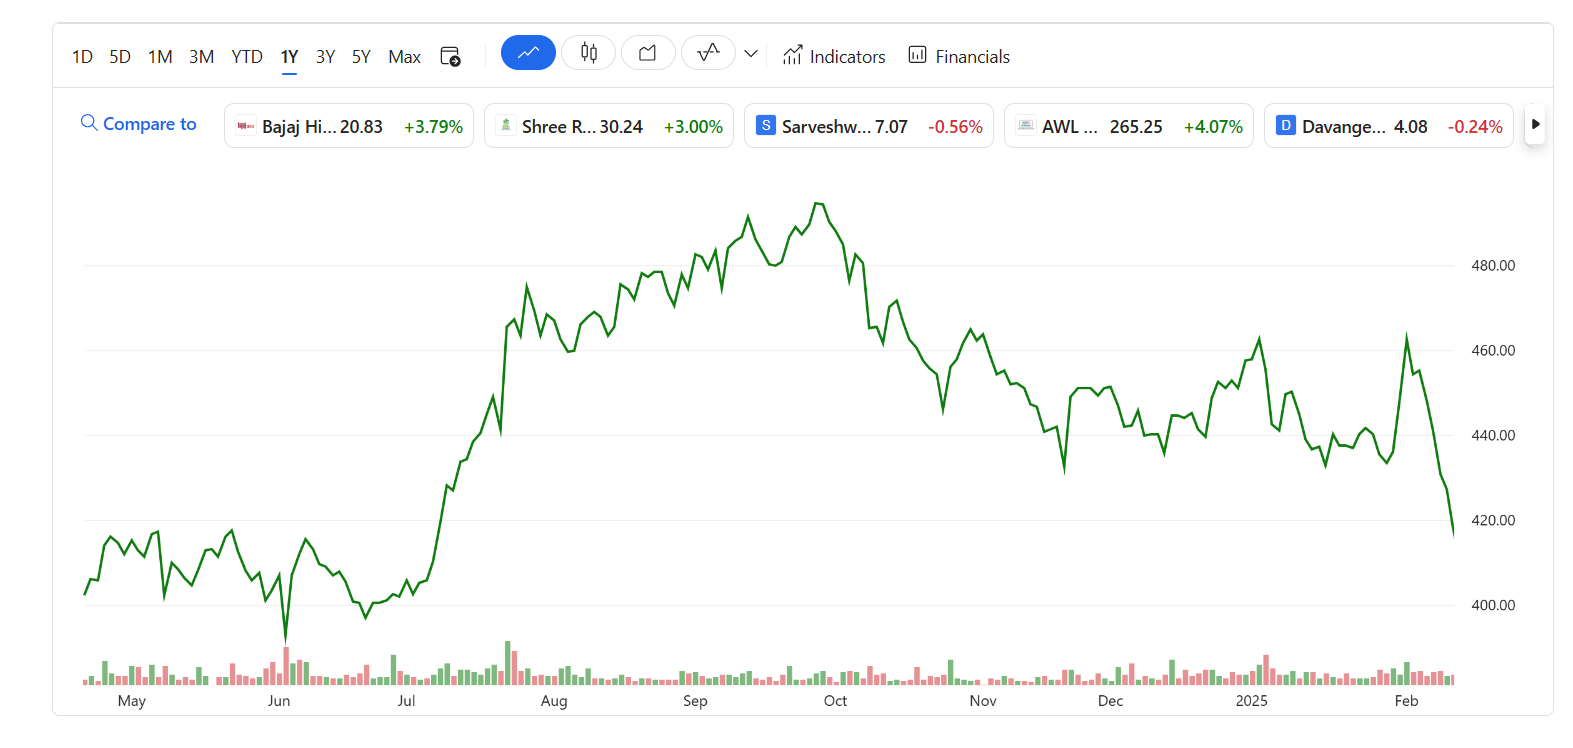
ITC Share Price History
ITC Share Price chart
| Date | Close (₹) | Open (₹) | High (₹) | Low (₹) |
|---|
ITC P/E Ratio Analysis
5-Year Historical Trend
Current Valuation (TTM)
Recent P/E Ratio History
| Year | P/E Ratio | Trend |
|---|---|---|
| 2022 | 22.5 | |
| 2023 | 24.8 | |
| 2024 | 26.1 | |
| 2025 (TTM) | 23.9 |
5-Year P/E Ratio Data
| Year | P/E Ratio | Growth |
|---|---|---|
| 2020 | 13.8 | — |
| 2021 | 17.5 | +26.8% |
| 2022 | 22.5 | +28.6% |
| 2023 | 24.8 | +10.2% |
| 2024 | 26.1 | +5.2% |
Key Observations
ITC Quarterly Financial Performance (Dec 2021 - Dec 2024)
Revenue vs Expenses Trend
Latest Quarter Overview (Dec-24)
| OPM | 34% |
| Net Profit | ₹5,013Cr |
| EPS | ₹3.94 |
Operating Profit Margin Trend
Detailed Quarterly Results
| Metric | Dec-24 | Sep-24 | Jun-24 | Mar-24 | Trend |
|---|---|---|---|---|---|
| Sales | 18,790 | 19,990 | 18,457 | 17,923 | |
| Net Profit | 5,013 | 5,054 | 5,177 | 5,191 | |
| OPM % | 34% | 33% | 37% | 37% |
Key Financial Ratios
Factors Influencing ITC PE Ratio
- Earnings Growth: At an EPS growth rate of 16.50% over the last 3 years, it is fair to say that the stock is worth the price.
- Industry Standard: The industry average per share price earnings traction for tobacco products is 26.0 which gives ITC a comparative edge.
- Market Sentiment: Good economy and good earnings generally raise the PE ratio.
- Business Performance: ITC’s FMCG, hospitality business has been on track to better revenue growth.
Conclusion
The ITC PE ratio of 25.6 as of March 22, 2025, indicates healthy investor confidence in the company’s growth potential. The assessment of ITC’s value depends on analysis between historical facts and business sector performance data along with earnings results.
Whether you’re a long-term investor or a short-term trader, understanding the ITC PE ratio can help you make informed decisions. Continued monitoring of upcoming earnings reports and market direction will help you determine ITC’s continued investment potential.
Stay informed, invest wisely, and monitor the ITC PE ratio regularly for optimal results.


