
Nifty FMCG Index
India's consumption story revolves around Fast-Moving Consumer Goods (FMCG), which provide a range of products from packaged foods and beverages to everyday essentials. The Nifty FMCG Index gives investors a taste of conservative growth, consistent dividend payouts, and stability in the face of market volatility by capturing the performance of India's top FMCG companies.
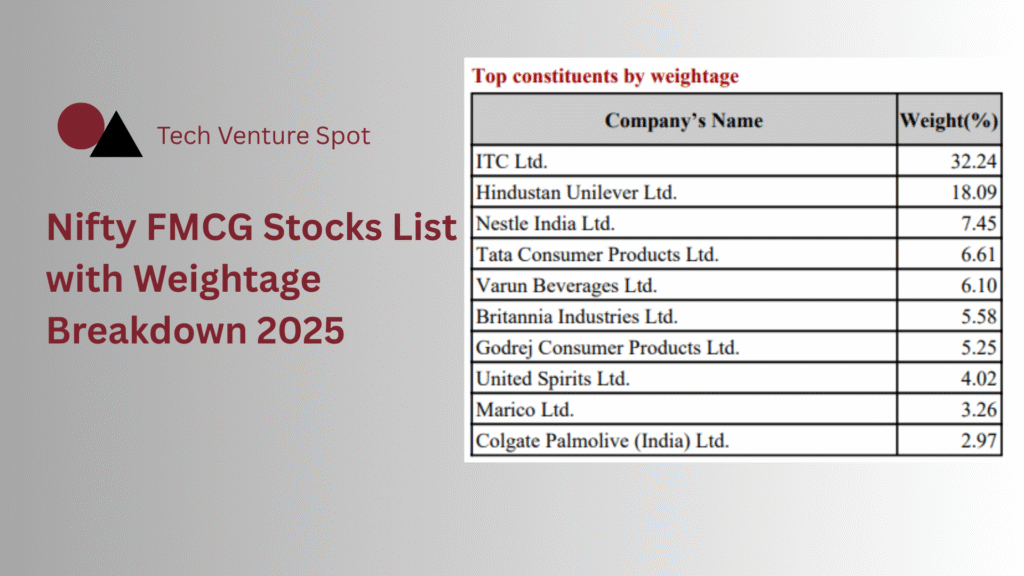
Nifty FMCG Index: 2025 Weightage Breakdown
Data as of May 28, 2025
The top 15 Nifty FMCG stocks for 2025 are listed below, arranged by index weight as of May 28, 2025.
| Rank | Company | Weightage (%) |
|---|
Daily Market Performance Snapshot
Top Gainers
| Symbol | % Chng | Chng | Day LOW | LTP | Day HIGH | Prev Close | Day Open | Volume (mn) | Turnover (mn) | 52w LOW | 52w High |
|---|---|---|---|---|---|---|---|---|---|---|---|
| EMAMILTD | 1.39% | 8.05 | 581.05 | 587.05 | 588.50 | 579.00 | 584.80 | 0.05 | 0.03 | 507.70 | 860.00 |
| BRITANNIA | 0.90% | 49.50 | 5,475.00 | 5,522.50 | 5,528.00 | 5,473.00 | 5,502.00 | 0.03 | 0.16 | 4,506.00 | 6,469.90 |
| RADICO | 0.80% | 19.70 | 2,455.50 | 2,475.40 | 2,505.50 | 2,455.70 | 2,456.00 | 0.06 | 0.14 | 1,429.85 | 2,665.00 |
| MARICO | 0.50% | 3.60 | 719.30 | 722.90 | 724.30 | 719.30 | 723.90 | 0.37 | 0.27 | 577.85 | 740.20 |
| HINDUNILVR | 0.31% | 7.30 | 2,356.00 | 2,369.30 | 2,371.90 | 2,362.00 | 2,369.00 | 0.10 | 0.24 | 2,136.00 | 3,035.00 |
| UNITDSPR | 0.29% | 4.40 | 1,519.20 | 1,527.10 | 1,529.00 | 1,522.70 | 1,525.10 | 0.04 | 0.06 | 1,136.30 | 1,700.00 |
| ITC | 0.02% | 0.10 | 419.75 | 420.30 | 422.80 | 420.20 | 422.00 | 2.57 | 1.08 | 390.15 | 528.50 |
Top Losers
| Symbol | % Chng | Chng | Day LOW | LTP | Day HIGH | Prev Close | Day Open | Volume (mn) | Turnover (mn) | 52w LOW | 52w High |
|---|---|---|---|---|---|---|---|---|---|---|---|
| UBL | -1.46% | -30.00 | 2,016.90 | 2,030.00 | 2,066.20 | 2,060.00 | 2,056.00 | 0.02 | 0.04 | 1,810.00 | 2,299.70 |
| GODREJCP | -1.02% | -12.90 | 1,228.50 | 1,246.10 | 1,261.90 | 1,259.00 | 1,260.00 | 0.17 | 0.21 | 979.50 | 1,541.85 |
| PATANJALI | -0.63% | -11.00 | 1,733.10 | 1,736.00 | 1,753.00 | 1,747.00 | 1,753.00 | 0.06 | 0.11 | 1,169.95 | 2,011.00 |
| COLPAL | -0.27% | -6.80 | 2,491.60 | 2,500.00 | 2,509.00 | 2,506.80 | 2,506.80 | 0.08 | 0.19 | 2,311.50 | 3,890.00 |
| TATACONSUM | -0.32% | -3.60 | 1,103.00 | 1,109.60 | 1,118.10 | 1,121.40 | 1,115.70 | 0.45 | 0.50 | 882.90 | 1,250.10 |
| NESTLEIND | -0.13% | -3.20 | 2,406.50 | 2,415.80 | 2,429.00 | 2,419.00 | 2,421.40 | 0.05 | 0.12 | 2,110.00 | 2,778.00 |
| VBL | -0.44% | -2.15 | 480.25 | 481.75 | 485.75 | 483.90 | 485.00 | 0.68 | 0.33 | 419.55 | 681.12 |
| DABUR | -0.37% | -1.80 | 481.10 | 482.90 | 484.85 | 484.70 | 484.70 | 0.19 | 0.09 | 433.30 | 672.00 |
Nifty FMCG Index: Portfolio Characteristics
- Launch Date
- September 22, 1999
- Base Date
- January 01, 1996
- Base Value
- 1000
- No. of Constituents
- 15
- Methodology
- Periodic Capped Free Float
- Calculation Frequency
- Real-Time
- Index Rebalancing
- Semi-Annually
Also Read: Mutual Fund Dividend Announcements & NFOs: 2025
Analysis of the 2025 Weightage Distribution
The Nifty FMCG Index comprises 15 leading consumer-goods companies, weighted by free-float market cap. The top ten constituents account for over 89% of the index’s total weight (calculation based on provided data: 89.75%).
Leading Position of the Top Two
Together, Hindustan Unilever and ITC account for more than 45% of the index weight (specifically 45.36%), highlighting their market dominance in a variety of industries, including food, tobacco, and personal care. Their substantial impact on index performance is a result of their huge free-float market caps.
Market Dominance: Hindustan Unilever Ltd. (23.29%) + ITC Ltd. (22.07%) = 45.36% of the Nifty FMCG Index.
Players in High-Growth Niches
Mid-weight brands like Britannia (5.53%) and Varun Beverages (6.86%) capitalize on the growing demand for packaged goods and beverages. Consistent share gains have been driven by Britannia's robust rural distribution network and Varun's premium beverage line.
Balance Between Staples and Premium
While staples heavyweights, such as Dabur and Patanjali, ensure defensive ballast, premium-segment stalwarts like Nestlé (at 9.79%) offer inflation-hedged growth through prepared foods, dairy, and coffee.
Exposure to Alcohol and Personal Care
By diversifying the FMCG basket into spirits and specialized personal-care markets, companies like United Spirits (4.65%), Radico Khaitan (1.38%), and Emami (1.06%) improve the index's non-cyclical resilience.
Long-Term Implications for Investors
An equitable Nifty FMCG allocation provides:
- Stable Returns: In the past, FMCG businesses have done better throughout recessions.
- Dividend Yield: Reliable dividends are usually paid by high-yield companies such as ITC and HUL.
- Protection from Inflation: Many constituents can pass on increases in input costs due to strong pricing power.
Index Movers: Top Movers and Draggers
This section outlines how individual stocks contributed to the index's movement on May 28, 2025.
| Symbol | Sector | Price % Chng | Price Chng | Index % Chng | Index Chng |
|---|---|---|---|---|---|
| HINDUNILVR | Fast Moving Consumer Goods | 0.5% | 11.8 | 0.09 | 51.43 |
| BRITANNIA | Fast Moving Consumer Goods | 1.05% | 57.5 | 0.06 | 33.31 |
| MARICO | Fast Moving Consumer Goods | 0.65% | 4.7 | 0.02 | 12.18 |
| EMAMILTD | Fast Moving Consumer Goods | 2% | 11.6 | 0.02 | 11.23 |
| RADICO | Fast Moving Consumer Goods | 0.86% | 21 | 0.01 | 8.06 |
| NESTLEIND | Fast Moving Consumer Goods | 0.18% | 4.4 | 0.01 | 7.75 |
| UNITDSPR | Fast Moving Consumer Goods | 0.21% | 3.2 | 0.01 | 4.64 |
| COLPAL | Fast Moving Consumer Goods | -0.11% | -2.7 | 0.00 | -1.75 |
| DABUR | Fast Moving Consumer Goods | -0.33% | -1.6 | -0.01 | -4.63 |
| PATANJALI | Fast Moving Consumer Goods | -0.61% | -10.6 | -0.01 | -5.77 |
| UBL | Fast Moving Consumer Goods | -1.48% | -30.5 | -0.02 | -10.81 |
| VBL | Fast Moving Consumer Goods | -0.42% | -2.05 | -0.02 | -13.51 |
| TATACONSUM | Fast Moving Consumer Goods | 0.03% | 0.3 | -0.05 | -25.27 |
| GODREJCP | Fast Moving Consumer Goods | -1.1% | -13.8 | -0.06 | -32.46 |
| ITC | Fast Moving Consumer Goods | -0.23% | -0.95 | -0.07 | -40.6 |


