
Infosys (INFY) P/E Ratio & Stock Analysis
25 June, 7:00 pm EDT · Market Closed
What is the P/E Ratio?
The Price-to-Earnings (P/E) ratio is a key metric for investors. One important indicator of how much investors pay for each rupee of Infosys's earnings is the Infosys P/E ratio.
It is calculated by dividing the market price per share by the earnings per share (EPS).
Why It Is Important
- Evaluates market expectations and can predict higher growth potential.
- Helps in evaluating industry-wide valuations (IT services companies typically trade at higher P/Es).
Historical P/E Ratio of Infosys (2016–2025)
Infosys's current PE ratio is 24.36 (TTM, June 26), which is marginally higher than its 10-year average of 22.77. Below is a chart and table showing the historical trend.
| Year | P/E Ratio (TTM) |
|---|---|
| 2016 | 20.46 |
| 2017 | 16.83 |
| 2018 | 15.84 |
| 2019 | 21.56 |
| 2020 | 15.55 |
| 2021 | 30.33 |
| 2022 | 35.68 |
| 2023 | 24.37 |
| 2024 | 23.59 |
| 2025 (est.) | 23.50 |
Important Lessons Learned:
Infosys P/E Ratio in 2000
A classic example of dot-com enthusiasm, Infosys' stock price peaked in February 2000 at ₹16,932. This indicated an eye-watering P/E of approximately 382 times its FY00 earnings.
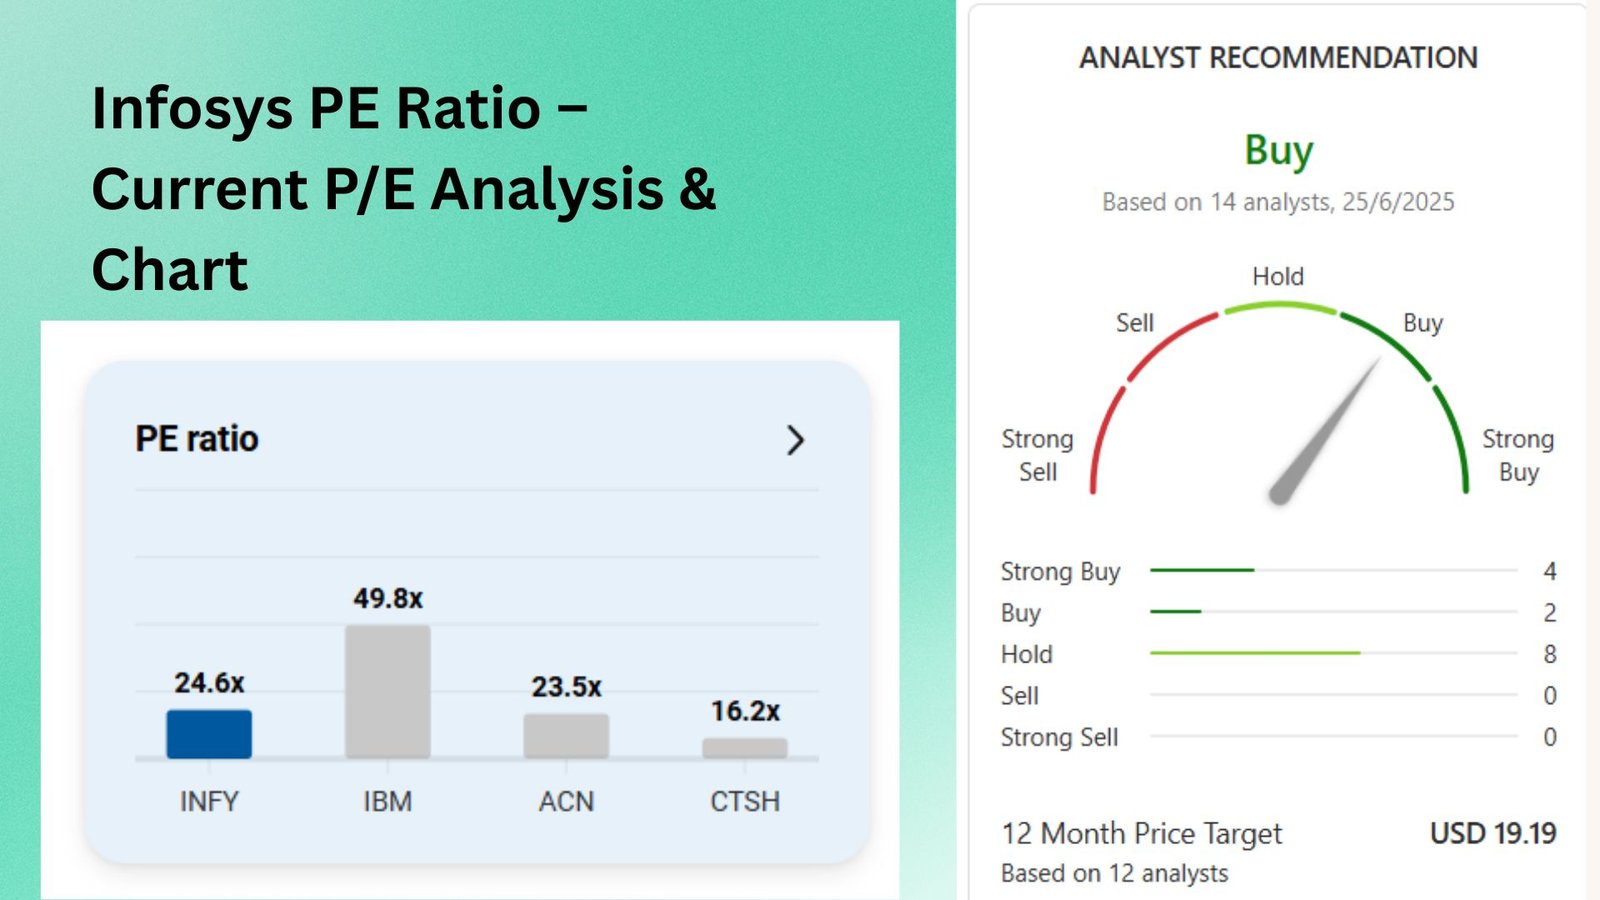
Peer Comparison: Industry P/E Ratios
Infosys Ltd.'s PE ratio is ranked in the middle when compared to its peers. It is valued higher than Wipro and Cognizant but lower than TCS and HCL.
| Company | Current P/E (TTM) |
|---|---|
| HCL Technologies | 26.74 |
| Tata Consultancy Services (TCS) | 26.23 |
| Accenture | 24.85 |
| Infosys | 24.36 |
| Wipro | 21.01 |
| Cognizant | 19.65 |
Detailed Financials
Per Share Values
| Metric | INFY (Mar 2025) | INFY (3-Yr Avg) | Software (1-Yr Avg) |
|---|---|---|---|
| Revenues | 98.53 | 92.84 | 9.43 |
| Earnings | 16.93 | 15.43 | 2.15 |
| Free Cash Flow | 80.55 | 38.47 | 4.84 |
| Dividend | 48.84 | - | 1.05 |
| Book Value | 230.69 | 197.22 | 29.43 |
Growth Rates
| Metric | INFY (Mar 2025) | INFY (3-Yr Avg) | Software (1-Yr Avg) |
|---|---|---|---|
| Revenue YoY | 7.92% | 10.57% | 0.21% |
| EPS YoY | -11.86% | 7.55% | 81.90% |
| FCF YoY | 45.22% | 17.81% | 56.97% |
| Dividends YoY | 37.91% | - | 10.05% |
| BV YoY | 8.60% | 8.32% | 33.92% |
Profitability
| Metric | INFY (Mar 2025) | INFY (3-Yr Avg) | Software (1-Yr Avg) |
|---|---|---|---|
| Gross Margin | 30.18% | 30.27% | 65.01% |
| Operating Margin | 20.95% | 20.94% | 25.89% |
| Net Margin | 17.20% | 16.64% | 24.58% |
| Return on Equity | 27.95% | 30.84% | 0.26% |
| Return on Capital | 8.26% | 6.79% | 7.05% |
Valuation
| Metric | TTM | Mar'25 | Quarterly | Software (1-Yr Avg) |
|---|---|---|---|---|
| Price to Sales | 0.05x | 0.05x | - | 8.89x |
| Price to Earnings | 24.58x | 0.31x | - | 41.76x |
| Price to Cash Flow | - | 0.12x | - | 11.91x |
| Price to Book | 0.08x | 0.09x | - | 11.64x |
| EV/EBITDA | - | - | - | 79.35x |
Case Study: Acquiring Infosys at the Proper P/E
- Scenario A: Acquired Infosys at P/E = 16 in 2017. As the P/E re-rated to 30, the stock increased 80% over three years.
- Scenario B: Overpaid in 2022 at a P/E of about 35. Returns fell behind peers when the P/E returned to its mid-20s level.
Conclusion
For a margin of safety, aim for a P/E ratio close to or below the 10-year median (~22.5). The current valuation is slightly premium but not in bubble territory.
FAQs about the Infosys P/E Ratio
What is Infosys's PE ratio today?
As of June 26, the Trailing Twelve Months (TTM) P/E ratio for Infosys is 24.36. You can see more details in the historical P/E section.
Is Infosys overvalued?
The current P/E is slightly higher than its 10-year historical average, suggesting a slight premium. However, it is significantly lower than its peak bubble levels, indicating it may not be excessively overvalued. See the peer comparison for context.
How does Infosys compare to its sector?
Infosys is positioned in the middle of its major competitors. It has a higher P/E than Wipro and Cognizant but a lower P/E than large-cap peers like TCS and HCL. Check the peer comparison chart for a visual breakdown.


Pingback: How to Invest in Crypto: Beginner's Guide to Start