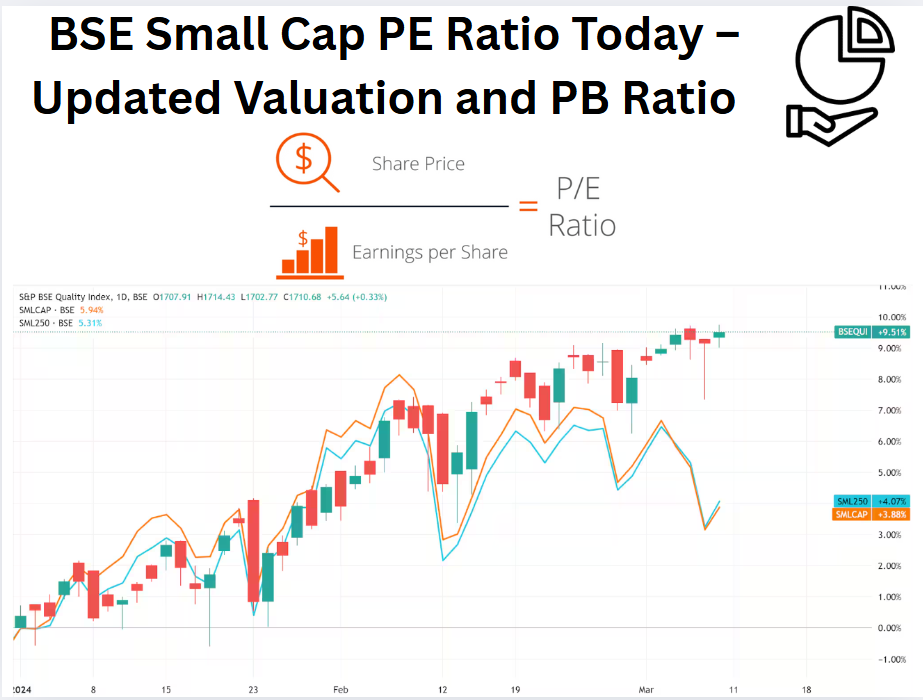
The BSE Small Cap PE Ratio is to be fair, one of those words that gets tossed around without really much thought to it many times causing either sheer panic or irrational exuberance and right now? This is what my analysis is suggesting: we might literally be looking at almost an entirely credible signal the single most exciting one of the years ahead.
That Headline PE Number? It is Only One-half (or Perhaps Less)
Just a quick glance at the "Total" weighted average PE ratio for the BSE Small Cap Index would yield values around 29.9x (based on TTM earnings according to our data). While it is compared with large caps topping at 21.6x, your immediate reaction should be, "Wow, small caps are expensive!"
But wait. That is where most analyses fail, and why an analysis that uses only aggregate estimation of the BSE Small Cap PE ratio can be misleading in a very dangerous manner.
Why the Median PE for the Dominant Bucket Matters More than the Aggregate BSE Small Cap PE Ratio?
When one thinks about investing in small caps, he is not thinking about filling small PSUs or obscure banks with stocks in them. You would probably be investing in those growth-oriented companies in the "Non-PSU/Pvt Bank" bucket. This is the relevant peer group for most small cap investors.
Compare apples to apples. The median PE for this dominant "growth" bucket in small caps is 33.3x. Compare it to the same bucket in large caps: the median PE is 42.0x! That's a lot more.
The Real Valuation Story: This comparison brings out the picture that the key small-cap growth companies are probably trading at a discount to large cap growth counterparts on the median PE lens. The aggregate BSE Small Cap PE ratio of 29.9x masked this possible opportunity.
Also Read: Nifty Smallcap PE Ratio Today – Jun 2025 Update
The Great Distortion: Why Weighted PE is a Cop Out
The biggest falsehood is the headline PE which screams "expensive!":
| Segment | Profit Share | PE Range | Impact on Index PE |
|---|---|---|---|
| Non-PSU/Pvt Banks (Growth) | 85% | 30-60× | Inflates average |
| PSUs | 9% | 8-20× | Drags down the averages |
| Private Banks | 6% | 5-15× | Minimal influence |
The Ferrari Vs. Alto Effect
"It's like weighting based on profits: averaging the price of a Ferrari with that of an Alto the luxury vehicle skews the result."
When 85% of profits are derived from high-growth companies (IT, consumer goods, chemicals), the PE appears inflated even if most small cap stocks trade at lower valuations.
American Idol: The Median PE Tells It Like It Is
Healthy disgust with averages. The median PE (middle value in a sorted list) exposes the reality of what companies experience as benchmark evidence:
💡 The Boldest Comparison
| Valuation Metric | Large Caps | Small Caps | Key Insight |
|---|---|---|---|
| Weighted Avg PE | 21.6× | 29.9× | Misleading! |
| Median PE (All) | 29.6× | 32.2× | Still skewed |
| Median PE (Growth Only) | 42.0× | 33.3× | Small caps are cheaper by 21% |
Core growth small caps have a 33.3× median PE compared to the 42.0× for large peers. This is a further discount hidden behind the average 29.9× figure.
The Global Small Cap Valuation Reset Beyond India
This opportunity is not only related to the trends here in India but also to what's happening in the world at large, particularly in the US. US small caps are starting to flash red and it matters for India:
- S&P 600 (US Small Cap) Forward P/E: Plunged to 10.95x, levels not seen from the depths of the Financial Crisis!
- Russell 2000 (US Small Cap) Current P/E: High overall figure of 63.9x; that excluding loss-makers, however, appears to be near 2020 lows—perhaps even below 10x.
- Underperformance: US Small Caps (Russell 2000) have greatly underperformed the S&P 500 (-10% against +41.8% over the past 4 years), pushing down valuations.
This global reset shows the pressure on small caps and resonates with value emerging in areas like the BSE Small Cap universe when seen through the right lens.
⚠️ The Killer Ratio: BSE Small Cap/Nifty at 2008 Levels
Here's another fascinating statistic, which I would consider my number 1 risk indicator for India: The ratio of the BSE Small Cap Index to the Nifty 50 is where it was in 2008.
What does that imply? Enormous outperformance by small caps has imitated the lead-up to the huge small-cap crash in 2018. Such extremes in ratios tend to have a corrective implication, even though specific valuation parameters may not appear overstretched.
What History Tells Us
When the BSE Small Cap/Nifty ratio peaked in the past:
- 2008 Peak: Followed by a -48% crash in the next 12 months.
- 2018 Similar High: Followed by a -60% bloodbath.
Translation: Extreme outperformance often leads to brutal corrections.
The 10-Year Paradox: Pain Before Gain
Here's a brain teaser: the BSE Small Cap index delivered about 0% price returns over the last decade (going from ~14,200 to ~14,700) despite the more recent run-up. This is a striking contrast against the strong ~19% CAGR in the last 20 years that bettered the performance of mid-cap and large-cap stocks.
What's the message?
- Volatility is Brutal: Small caps go through devastating drawdowns (like in 2018-2020) that can wipe out years of gains.
- Entry Valuation is CRUCIAL: Phenomenal returns follow purchases after a great crash (like 2020). Buying at the peak (like 2018 or possibly now) can lead to a considerable duration of pain.
- Long-Term Potential: The 20-year track record is irrefutable proof of the promise for wealth creation if one can navigate the volatility.
Also Read: Google (Alphabet) PE Ratio 2025: Historical Chart, TTM
📌 Understanding the BSE Small Cap PE Ratio in Your Portfolio
So, what must an investor do at this point? Here's a breakdown of the conflicting signals.
| Metric | Large Caps | Small Caps | Verdict |
|---|---|---|---|
| Headline PE | 21.6× | 29.9× | Red herring |
| Growth Segment Median | 42.0× | 33.3× | Small caps cheaper |
| Profit Dominance | PSU (33%) | Growth (85%) | Skew explained |
| Global PE Anchor | S&P 500: 22.9× | S&P 600: 10.9× | Downside risk |
The Bottom Line: Surviving the Small Cap Crossroads
The BSE Small Cap PE ratio is neither a simple buy nor sell signal. There are layers to this story:
- Value Potential in the Core: The median valuation of growth-oriented small-caps looks reasonable compared to their large-cap peers.
- Historical Warning: The BSE Small Cap / Nifty ratio is screaming a warning from 2008 levels, suggesting the broad index is over-extended.
- Veering Global Forces: The dramatic valuation reset in US small caps is a sign of global pressure that could spill over into India.
My Take: This market is for stock pickers, not index huggers. Throwing money blindly at the BSE Small Cap index is a perilous journey. However, for those willing to do the homework, high-quality, growth-oriented small-cap companies may offer attractive relative value.
Your Action Plan 🚀
1. Prioritize Quality and Selectivity
Momentum investing or passive index investing in small caps is risky right now. Concentrate on:
- High-Quality Businesses: Look for strong balance sheets, sustainable competitive advantages, and good management.
- Reasonable Growth Expectations: Avoid stocks priced for perfection.
2. Demand a Margin of Safety
A median PE of 33.3x doesn't justify any price. You must buy below your conservative estimate of a company's intrinsic value. Do not overpay.
3. Consider Dollar-Cost Averaging (DCA)
Given the conflicting signals, gradually deploying capital via DCA might be a prudent way forward. This reduces the risk of investing a lump sum at a market peak.
4. Clean Up Your Portfolio
As wisely noted, it's a "good time to clean up the portfolio." Pull out low-quality, highly-touted small caps that lack fundamentals. If small caps have exceeded your target allocation, rebalance your portfolio.
Also Read: 5 starsstocks.com Income Stocks: Best Picks & Guide 2025
Frequently Asked Questions
The mathematical derivation is correct, but in most cases, the interpretation of the composite number is flawed because of heavy sector skew (like 85% profits from higher-PE companies). Thus, median PE, especially among sectors, makes much more sense.
Quite complex. The headline BSE Small Cap PE ratio looking at something like 29.9x TTM sure looks high. However, the median PE of the leading growth sector within small caps (33.3x) is actually below that of the same sector in large caps (42.0x), which would argue relative value. BUT - the extreme BSE Small Cap/Nifty ratio warns of an outright overextension across the board. Specific stock valuations should be the focus.
It looks at how small caps perform compared to large caps; if it reaches levels of 2008, it indicates a historically extreme relative outperformance of small caps, which usually signals periods of adverse performance or even corrections afterwards (like in 2018). It is a big warning signal.
For wide indices with heavy sector skews (like BSE Small Cap), median PE is usually better to understand 'typical' company valuation, while weighted average is easily distorted by a handful of big profit (or loss-making) companies.
Not simply on the PE ratio. The median PE of the growth bucket suggests potential relative value versus large-cap growth, but the extreme BSE Small Cap/Nifty ratio is a call for caution. Concentrate on high-quality individual companies that are trading below intrinsic value. Do not bet on broad indexes. Use dollar-cost averaging and be specific with regard to upper limits of portfolio allocation.


