
Nifty Energy Index: A 2025 Deep Dive for Investors
Due to India’s fast-growing economy, energy demand has surged, making the performance of energy companies a critical focus for investors. The Nifty Energy Index tracks the movements of 40 leading energy-sector companies on the NSE, serving as a key gauge for this vital segment.
In 2025, understanding the Nifty Energy Index is more important than ever due to changing regulations, the rise of greener energy, and volatile oil prices. Analyzing the index's structure helps investors spot sector movements, evaluate their holdings, and identify opportunities within the broader market.
What is Understood by the Nifty Energy Index?
The index reflects the performance of India's leading energy companies. It is composed of firms engaged in:
- Oil & Gas: Exploration, production, and distribution of petroleum and gas.
- Power: Generation, transmission, and distribution of electricity.
- Capital Goods: Companies providing equipment for the energy sector, such as electric machinery and wind turbines.
The index utilizes a free-float market capitalization methodology, meaning a stock's weight is determined by its publicly available shares. This provides a clear benchmark for comparing energy company performance against the Nifty 50.
Also Read: NIFTY Midcap 100 Stock List – With Price & WeightageHow the Index Is Constructed
- Universe Selection: Companies must belong to the Nifty 500 and be categorized in eligible energy sub-industries. If fewer than ten stocks qualify, the selection expands to the top 800 equities based on turnover and market capitalization.
- Listing and Liquidity: Stocks must be listed for at least one month and have a minimum trading frequency of 90% over the last six months.
- Final Selection: The top 40 stocks are chosen based on their free-float market capitalization.
- Weight Caps: To ensure diversification, the top three stocks are capped at a combined weight of 62%, and any single stock cannot exceed 33%.
Complete List of Nifty Energy Stocks in 2025
Use the search box below to filter companies by name or ticker.
| Company Name | Ticker | Sector | Weight (%) |
|---|---|---|---|
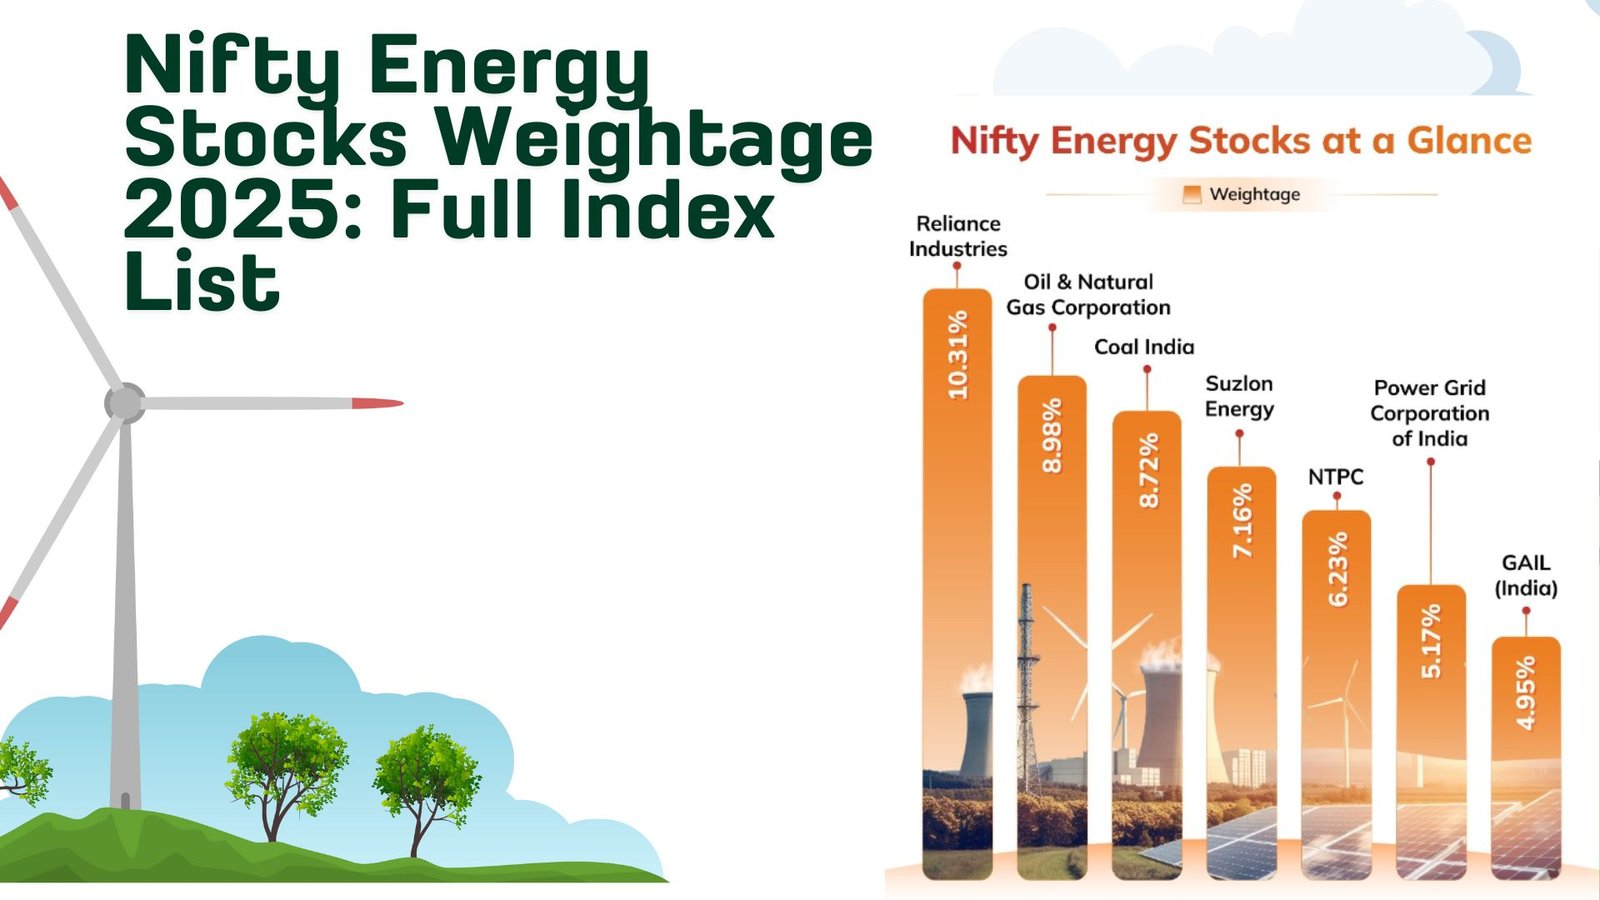
| Reliance Industries Ltd | RELIANCE | Oil Gas & Consumable Fuels | 10.31 |
| Oil & Natural Gas Corporation Ltd | ONGC | Oil Gas & Consumable Fuels | 8.98 |
| Coal India Ltd | COALINDIA | Oil Gas & Consumable Fuels | 8.72 |
| Suzlon Energy Ltd | SUZLON | Capital Goods | 7.16 |
| NTPC Ltd | NTPC | Power | 6.23 |
| Power Grid Corporation of India Ltd | POWERGRID | Power | 5.17 |
| GAIL (India) Ltd | GAIL | Oil Gas & Consumable Fuels | 4.95 |
| CG Power and Industrial Solutions Ltd | CGPOWER | Capital Goods | 3.71 |
| Bharat Heavy Electricals Ltd | BHEL | Capital Goods | 2.82 |
| ABB India Ltd | ABB | Capital Goods | 2.64 |
| Tata Power Co. Ltd | TATAPOWER | Power | 2.60 |
| Siemens Ltd | SIEMENS | Capital Goods | 2.44 |
| GE Vernova T&D India Ltd | GVT&D | Capital Goods | 2.34 |
| Oil India Ltd | OIL | Oil Gas & Consumable Fuels | 2.25 |
| Petronet LNG Ltd | PETRONETLN | Oil Gas & Consumable Fuels | 2.23 |
| Hitachi Energy India Ltd | POWERINDIA | Capital Goods | 2.07 |
| Adani Total Gas Ltd | ADANITOTGAS | Oil Gas & Consumable Fuels | 1.83 |
| Bharat Petroleum Corporation Ltd | BPCL | Oil Gas & Consumable Fuels | 1.81 |
| Adani Power Ltd | ADANIPOWER | Power | 1.68 |
| Indian Oil Corporation Ltd | IOC | Oil Gas & Consumable Fuels | 1.55 |
| Indraprastha Gas Ltd | IGL | Oil Gas & Consumable Fuels | 1.40 |
| Adani Energy Solutions Ltd | ADANIENT | Power | 1.24 |
| Adani Green Energy Ltd | ADANIGREEN | Power | 1.22 |
| Hindustan Petroleum Corporation Ltd | HPCL | Oil Gas & Consumable Fuels | 1.16 |
| Thermax Ltd | THERMAX | Capital Goods | 1.11 |
| Inox Wind Ltd | INOXWIND | Capital Goods | 1.10 |
| NHPC Ltd | NHPC | Power | 1.09 |
| Gujarat State Petronet Ltd | GSPC | Oil Gas & Consumable Fuels | 1.06 |
| Torrent Power Ltd | TORNTPOWER | Power | 1.03 |
| JSW Energy Ltd | JSWENERGY | Power | 1.03 |
| Aegis Logistics Ltd | AEGISCHEM | Oil Gas & Consumable Fuels | 0.97 |
| Gujarat Gas Ltd | GUJGAS | Oil Gas & Consumable Fuels | 0.77 |
| Mahanagar Gas Ltd | MGL | Oil Gas & Consumable Fuels | 0.73 |
| Reliance Power Ltd | RPOWER | Power | 0.64 |
| Triveni Turbine Ltd | TRITURBINE | Capital Goods | 0.56 |
| CESC Ltd | CESC | Power | 0.40 |
| NLC India Ltd | NLCINDIA | Power | 0.31 |
| Castrol India Ltd | CASTROLIND | Oil Gas & Consumable Fuels | 0.31 |
| Jaiprakash Power Ventures Ltd | JPPOWER | Power | 0.29 |
| SJVN Ltd | SJVN | Power | 0.27 |
Sector Allocation Within the Index
The Nifty Energy Index is diversified across three primary sectors, showcasing a blend of traditional and emerging energy areas.
Sector-Wise Breakdown & Key Themes
Oil & Gas (47.00% Weight)
This sector shows strong dominance. Key themes include:
- Government hydrocarbon policy impacting ONGC and Coal India.
- Transmission price reforms for GAIL and Petronet LNG.
- Potential privatization of BPCL/HPCL altering valuations.
Power (33.40% Weight)
Demand for power utilities is expected to rise. Key themes include:
- New renewable capacity additions by Adani Green and JSW Energy.
- Operational performance of NTPC.
- Transmission expansion efforts by Power Grid.
Capital Goods (19.60% Weight)
Growth and consolidation are key features. Key themes include:
- Investment in local power equipment, benefiting Siemens, ABB, and GE.
- Wind-turbine production levels for Suzlon and Inox Wind.
- Pollution-control and boiler projects driving aftermarket services.
The Impact of Policy, ESG, and Global Energy Prices
- Policy Shifts: Government focus on green energy boosts companies like Adani Green and JSW. Coal sector regulations may limit Coal India's growth.
- ESG Trends: Investors favoring clean energy are drawn to solar and wind manufacturers like Inox Wind.
- Global Energy Prices: Fluctuations in crude oil directly impact the profits and index weightages of companies like ONGC, BPCL, and IOC.
Performance Metrics & Risk Profile
Key financial metrics for the Nifty Energy Index provide insight into its valuation and risk.
| Metric | Index Level (Nifty Energy) | Source |
|---|---|---|
| Index PE (TTM) | 16.74 | NSE Factsheet |
| Index PB (TTM) | 2.19 | NSE Factsheet |
| Dividend Yield | 2.64% | NSE Factsheet |
| 1-Year Standard Deviation | 20.88% (Annualized) | - |
| Beta vs Nifty 50 | 1.36 | - |
| Correlation with Nifty 50 | 0.97 | - |
To Sum Up: Key Takeaways for 2025
The 2025 weightage of the Nifty Energy Index offers critical insights for investors:
- Dominant Drivers: Reliance Industries (10.31%) continues to be a primary driver of the index's performance.
- Sector Balance: While Oil & Gas is the largest sector (47%), Power and Capital Goods collectively account for 53%, indicating significant industry diversification.
- Emerging Players: Companies like Adani Green, JSW Energy, Hitachi Energy, and GE Vernova T&D are gaining importance, reflecting the shift towards renewables and advanced technology.
- Risk Mitigation: Weight capping ensures the top 3 stocks do not dominate the index, reducing concentration risk for investors.


Pingback: 5starsstocks.com Income Stocks: Best Picks & Guide 2025